Not All Galaxies Are Lonely. Some Have Galaxy Squads.
Not all galaxies are lonely. Some have galaxy squads.
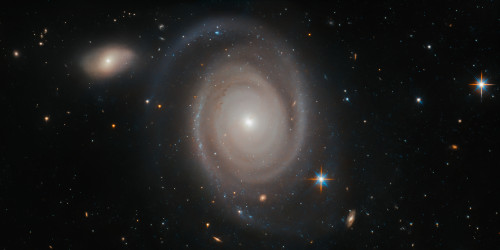
NGC 1706, captured in this image by our Hubble Space Telescope, belongs to something known as a galaxy group, which is just as the name suggests — a group of up to 50 galaxies which are gravitationally bound and relatively close to each other.
Our home galaxy, the Milky Way, has its own squad — known as the Local Group, which also contains the Andromeda galaxy, the Large and Small Magellanic clouds and the Triangulum galaxy.
Make sure to follow us on Tumblr for your regular dose of space: http://nasa.tumblr.com.
More Posts from Nasa and Others
@barnabasthebarmy: How do you deal with being cooped up with other people for so long?
Hello Serena! I was wondering if given the chance would you be apart of a mission to mars in the near future, and if you could bring a personal item with you what would it be?
Counting Down to ICON's Launch
In October 2018, we're launching the Ionospheric Connection Explorer, or ICON, to study Earth's dynamic interface to space.

The region of Earth's atmosphere on the edge of space plays a crucial role in our technology and exploration. This is where many of our satellites — including the International Space Station — orbit, and changing conditions in this region can cause problems for those satellites and disrupt communications signals.
This part of the atmosphere is shaped by a complicated set of factors. From below, regular weather on Earth can propagate upwards and influence this region. From above, electric and magnetic fields and charged particles in space — collectively called space weather — can also trigger changes. ICON's goal is to better understand this region and how it's shaped by these outside influences.
10-mile-per-hour sensitivity
Though the ICON spacecraft zooms around Earth at upwards of 14,000 miles per hour, its wind-measuring instrument, named MIGHTI, can detect changes in wind speed smaller than 10 miles per hour. MIGHTI measures the tiny shifts in color caused by the motion of glowing gases in the upper atmosphere. Then, by making use of the Doppler effect — the same phenomenon that makes an ambulance siren change pitch as it passes you — scientists can figure out the gases' speed and direction.

97-minute orbital period
ICON circles Earth in just over an hour and a half, completing nearly 15 orbits per day. Its orbit is inclined by 27 degrees, so over time, its measurements will completely cover the latitudes scientists are most interested in, near the equator.

8 1/3-foot solar panel
ICON doesn't carry any onboard fuel. Instead, its single solar panel — measuring about 100 inches long and 33 inches wide, a little bit bigger than a standard door — produces power for the spacecraft. In science mode, ICON draws about 209-265 Watts of power.
7 years of teamwork
Now getting ready for launch, the ICON team has been hard at work ever since the idea for the mission was selected for further study in 2011.
634 pounds
How much does good science weigh? In ICON's case, about as much as vending machine. The observatory weighs 634 pounds altogether.
5 snapshots per minute from FUV
Because ICON travels so fast, its Far Ultraviolet instrument takes eight snapshots per second of passing structures. This avoids blurring the images and captures the fine detail scientists need. But available bandwidth only allows FUV to send 5 images per minute, so the instrument uses a de-blurring technique called time-delay integration to combine 12 seconds' worth of data into a single image.

Image credit: Mark Belan
4 types of instruments collecting data in tandem
ICON carries four distinct instruments to study Earth's boundary to space.
2 MIGHTIs (Michelson Interferometer for Global High-resolution Thermospheric Imaging): Built by the Naval Research Laboratory in Washington, D.C., to observe the temperature and speed of the neutral atmosphere. There are two identical MIGHTI instruments onboard ICON.
2 IVMs (Ion Velocity Meter): Built by the University of Texas at Dallas to observe the speed of the charged particle motions, in response to the push of the high-altitude winds and the electric fields they generate. ICON carries two, and they are the mission’s only in situ instruments.
EUV (Extreme Ultra-Violet instrument): Built by the University of California, Berkeley to capture images of oxygen glowing in the upper atmosphere, in order to measure the height and density of the daytime ionosphere.
FUV (Far Ultra-Violet instrument): Built by UC Berkeley to capture images of the upper atmosphere in the far ultraviolet light range. At night, FUV measures the density of the ionosphere, tracking how it responds to weather in the lower atmosphere. During the day, FUV measures changes in the chemistry of the upper atmosphere — the source for the charged gases found higher up in space.
360 miles above Earth
ICON orbits about 360 miles above Earth, near the upper reaches of the ionosphere — the region of Earth's atmosphere populated by electrically charged particles. From this vantage point, ICON combines remote measurements looking down along with direct measurements of the material flowing around it to connect changes throughout this region.

2 missions working together
NASA's GOLD mission — short for Global-scale Observations of the Limb and Disk — launched aboard a commercial communications satellite on Jan. 25, 2018. From its vantage point in geostationary orbit over Brazil, GOLD gets a full-disk view of the same region of space that ICON studies, helping scientists connect the big picture with the details.
1 gigabit of data per day
Together, ICON's instruments produce and downlink about 1 gigabit of data per day — about 125 megabytes. This adds up to about 1 gigabyte per week. ICON produces 10 different data products, ranging from measurements of wind speeds and ionospheric density to more complex models, that will help scientists shed new light on this ever-changing region.
ICON’s launch is scheduled for 4 a.m. EDT on Oct. 26, and NASA TV coverage begins at 3:45 a.m. Stay tuned on Twitter and Facebook for the latest on ICON.
Make sure to follow us on Tumblr for your regular dose of space: http://nasa.tumblr.com.
Confirmed: Summer 2023 Hottest in NASA’s Record
All three months of summer 2023 broke records. July 2023 was the hottest month ever recorded, and the hottest July. June 2023 was the hottest June, and August 2023 was the hottest August.
NASA’s temperature record, GISTEMP, starts in 1880, when consistent, modern recordkeeping became possible. Our record uses millions of measurements of surface temperature from weather stations, ships and ocean buoys, and Antarctic research stations. Other agencies and organizations who keep similar global temperature records find the same pattern of long-term warming.
Global temperatures are rising from increased emissions of greenhouse gasses, like carbon dioxide and methane. Over the last 200 years, humans have raised atmospheric CO2 by nearly 50%, primarily through the burning of fossil fuels.
Drivers of climate change, both natural and human-caused, leave distinct fingerprints. Through observations and modeling, NASA researchers confirm that the current warming is the result of human activities, particularly increased greenhouse gas emissions.
is there a pre-flight personal ritual that you do before piloting a flight?
How does it feel to take a walk in space?
How exactly will it work? And whats the goal of the project?
Caution: Universe Work Ahead 🚧
We only have one universe. That’s usually plenty – it’s pretty big after all! But there are some things scientists can’t do with our real universe that they can do if they build new ones using computers.
The universes they create aren’t real, but they’re important tools to help us understand the cosmos. Two teams of scientists recently created a couple of these simulations to help us learn how our Nancy Grace Roman Space Telescope sets out to unveil the universe’s distant past and give us a glimpse of possible futures.
Caution: you are now entering a cosmic construction zone (no hard hat required)!

This simulated Roman deep field image, containing hundreds of thousands of galaxies, represents just 1.3 percent of the synthetic survey, which is itself just one percent of Roman's planned survey. The full simulation is available here. The galaxies are color coded – redder ones are farther away, and whiter ones are nearer. The simulation showcases Roman’s power to conduct large, deep surveys and study the universe statistically in ways that aren’t possible with current telescopes.
One Roman simulation is helping scientists plan how to study cosmic evolution by teaming up with other telescopes, like the Vera C. Rubin Observatory. It’s based on galaxy and dark matter models combined with real data from other telescopes. It envisions a big patch of the sky Roman will survey when it launches by 2027. Scientists are exploring the simulation to make observation plans so Roman will help us learn as much as possible. It’s a sneak peek at what we could figure out about how and why our universe has changed dramatically across cosmic epochs.
This video begins by showing the most distant galaxies in the simulated deep field image in red. As it zooms out, layers of nearer (yellow and white) galaxies are added to the frame. By studying different cosmic epochs, Roman will be able to trace the universe's expansion history, study how galaxies developed over time, and much more.
As part of the real future survey, Roman will study the structure and evolution of the universe, map dark matter – an invisible substance detectable only by seeing its gravitational effects on visible matter – and discern between the leading theories that attempt to explain why the expansion of the universe is speeding up. It will do it by traveling back in time…well, sort of.
Seeing into the past
Looking way out into space is kind of like using a time machine. That’s because the light emitted by distant galaxies takes longer to reach us than light from ones that are nearby. When we look at farther galaxies, we see the universe as it was when their light was emitted. That can help us see billions of years into the past. Comparing what the universe was like at different ages will help astronomers piece together the way it has transformed over time.

This animation shows the type of science that astronomers will be able to do with future Roman deep field observations. The gravity of intervening galaxy clusters and dark matter can lens the light from farther objects, warping their appearance as shown in the animation. By studying the distorted light, astronomers can study elusive dark matter, which can only be measured indirectly through its gravitational effects on visible matter. As a bonus, this lensing also makes it easier to see the most distant galaxies whose light they magnify.
The simulation demonstrates how Roman will see even farther back in time thanks to natural magnifying glasses in space. Huge clusters of galaxies are so massive that they warp the fabric of space-time, kind of like how a bowling ball creates a well when placed on a trampoline. When light from more distant galaxies passes close to a galaxy cluster, it follows the curved space-time and bends around the cluster. That lenses the light, producing brighter, distorted images of the farther galaxies.
Roman will be sensitive enough to use this phenomenon to see how even small masses, like clumps of dark matter, warp the appearance of distant galaxies. That will help narrow down the candidates for what dark matter could be made of.

In this simulated view of the deep cosmos, each dot represents a galaxy. The three small squares show Hubble's field of view, and each reveals a different region of the synthetic universe. Roman will be able to quickly survey an area as large as the whole zoomed-out image, which will give us a glimpse of the universe’s largest structures.
Constructing the cosmos over billions of years
A separate simulation shows what Roman might expect to see across more than 10 billion years of cosmic history. It’s based on a galaxy formation model that represents our current understanding of how the universe works. That means that Roman can put that model to the test when it delivers real observations, since astronomers can compare what they expected to see with what’s really out there.

In this side view of the simulated universe, each dot represents a galaxy whose size and brightness corresponds to its mass. Slices from different epochs illustrate how Roman will be able to view the universe across cosmic history. Astronomers will use such observations to piece together how cosmic evolution led to the web-like structure we see today.
This simulation also shows how Roman will help us learn how extremely large structures in the cosmos were constructed over time. For hundreds of millions of years after the universe was born, it was filled with a sea of charged particles that was almost completely uniform. Today, billions of years later, there are galaxies and galaxy clusters glowing in clumps along invisible threads of dark matter that extend hundreds of millions of light-years. Vast “cosmic voids” are found in between all the shining strands.
Astronomers have connected some of the dots between the universe’s early days and today, but it’s been difficult to see the big picture. Roman’s broad view of space will help us quickly see the universe’s web-like structure for the first time. That’s something that would take Hubble or Webb decades to do! Scientists will also use Roman to view different slices of the universe and piece together all the snapshots in time. We’re looking forward to learning how the cosmos grew and developed to its present state and finding clues about its ultimate fate.

This image, containing millions of simulated galaxies strewn across space and time, shows the areas Hubble (white) and Roman (yellow) can capture in a single snapshot. It would take Hubble about 85 years to map the entire region shown in the image at the same depth, but Roman could do it in just 63 days. Roman’s larger view and fast survey speeds will unveil the evolving universe in ways that have never been possible before.
Roman will explore the cosmos as no telescope ever has before, combining a panoramic view of the universe with a vantage point in space. Each picture it sends back will let us see areas that are at least a hundred times larger than our Hubble or James Webb space telescopes can see at one time. Astronomers will study them to learn more about how galaxies were constructed, dark matter, and much more.
The simulations are much more than just pretty pictures – they’re important stepping stones that forecast what we can expect to see with Roman. We’ve never had a view like Roman’s before, so having a preview helps make sure we can make the most of this incredible mission when it launches.
Learn more about the exciting science this mission will investigate on Twitter and Facebook.
Make sure to follow us on Tumblr for your regular dose of space!
@mothdog: What is something everyone needs to know about the International Space Station and science in space?
Falling Into Jupiter
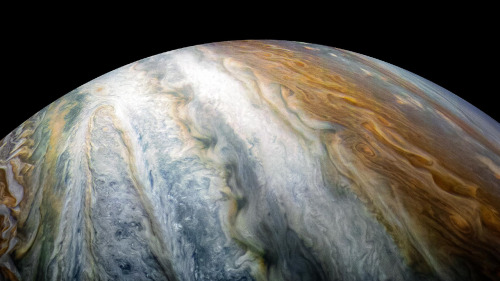
Twenty-five years ago, an object roughly the size of an oven made space history when it plunged into the clouds of Jupiter, the largest planet in our solar system. On Dec. 7, 1995, the 750-pound Galileo probe became the first probe to enter the gas giant. Traveling at a blistering speed of 106,000 miles per hour, the probe’s protective heat shield experienced temperatures as hot as the Sun’s surface generated by friction during entry. As the probe parachuted through Jupiter’s dense atmosphere, its science instruments made measurements of the planet’s chemical and physical makeup. The probe collected data for nearly an hour before its signal was lost. Its data was transmitted to Earth via the Galileo spacecraft, an orbiter that carried the probe to Jupiter and stayed within contact during the encounter. Learn more about the mission.
The Galileo probe was launched to space aboard space shuttle Atlantis in 1989

The probe consisted of a descent module and a protective deceleration module

The probe traveled to Jupiter attached to the Galileo spacecraft

The probe was released from the spacecraft in July 1995

The probe entered Jupiter’s atmosphere five months later on Dec. 7, 1995

Parachutes were deployed to slow the probe’s descent

The probe collected science data for 58 minutes as it fell into the planet’s atmosphere

The Galileo probe was managed by NASA’s Ames Research Center in California’s Silicon Valley.
Make sure to follow us on Tumblr for your regular dose of space: http://nasa.tumblr.com
-
 pepperonipizzawithchocolate liked this · 2 years ago
 -
 stardating reblogged this · 2 years ago
 -
 fallingviolets liked this · 2 years ago
 -
 thomasbolt reblogged this · 3 years ago
 -
thomasbolt liked this · 3 years ago
-
 gardenof3d3n liked this · 3 years ago
 -
 jurgenbcn liked this · 4 years ago
 -
 getas-regina reblogged this · 4 years ago
 -
getas-regina liked this · 4 years ago
-
 annawintortellini liked this · 4 years ago
 -
 keeponmovingss liked this · 4 years ago
 -
 enve10pes liked this · 4 years ago
 -
 bonsoir-idiot reblogged this · 4 years ago
 -
bonsoir-idiot liked this · 4 years ago
-
 ysvisuals reblogged this · 4 years ago
 -
 idontknowhowtonameblr liked this · 4 years ago
 -
 arialis reblogged this · 4 years ago
 -
 onii-same reblogged this · 4 years ago
 -
 cloexbrosluvr reblogged this · 5 years ago
 -
 wataru85 reblogged this · 5 years ago
 -
 meanderingandrambling reblogged this · 5 years ago
 -
meanderingandrambling liked this · 5 years ago
-
 chatousgirl liked this · 5 years ago
 -
 pyschex liked this · 5 years ago
 -
 dimens1ons liked this · 5 years ago
 -
 skyvorysworld liked this · 5 years ago
 -
 spacetimewithstuartgary reblogged this · 5 years ago
 -
 brightestofcentaurus reblogged this · 5 years ago
 -
 dalvisson-blog liked this · 5 years ago
 -
 snailswithwings reblogged this · 5 years ago
 -
 11511 reblogged this · 5 years ago
 -
 bbbyaries liked this · 5 years ago
 -
 anaxaver reblogged this · 5 years ago
 -
 rcgerina liked this · 5 years ago
 -
 nyctolemon liked this · 5 years ago
 -
 backlovefuck liked this · 5 years ago
Explore the universe and discover our home planet with the official NASA Tumblr account
1K posts