Moving At The Speed Of Arctic Ice
Moving at the Speed of Arctic Ice
Time-lapses taken from space can help track how Earth’s polar regions are changing, watching as glaciers retreat and accelerate, and ice sheets melt over decades.

Using our long data record and a new computer program, we can watch Alaskan glaciers shift and flow every year since 1972. Columbia Glacier, which was relatively stable in the 1970s, has since retreated rapidly as the climate continues to warm.

The Malaspina Glacier has pulsed and spread and pulsed again. The flashes and imperfect frames in these time-lapses result from the need for cloud-free images from each year, and the technology limitations of the early generation satellites.

In Greenland, glaciers are also reacting to the warming climate. Glaciers are essentially frozen rivers, flowing across land. As they get warmer, they flow faster and lose more ice to the ocean. On average, glaciers in Greenland have retreated about 3 miles between 1985 and 2018. The amount of ice loss was fairly consistent for the first 15 years of the record, but started increasing around 2000.

Warmer temperatures also affect Greenland farther inland, where the surface of ice sheets and glaciers melts, forming lakes that can be up to 3 miles across. Over the last 20 years, the number of meltwater lakes forming in Greenland increased 27% and appeared at higher elevations, where temperatures were previously too cold for melt.

Whether they're studying how ice flows into the water, or how water pools atop ice, scientists are investigating some of the many aspects of how climate affects Earth's polar regions.
For more information, visit climate.nasa.gov.
Make sure to follow us on Tumblr for your regular dose of space: http://nasa.tumblr.com.
More Posts from Nasa and Others

I am excited to be hosting my first ever tumblr Answer Time tomorrow, Thursday October 29 at 3pm (Eastern).
Ever wonder what it’s like to be a NASA astronaut, how the NASA Village helps me train for my mission to space, or what the challenges of living in space are like? This is your chance to ask me questions.
Enter your questions here, I will answer them tomorrow.
5 Facts About Earth's Radiation Donuts 🍩
Did you know that our planet is surrounded by giant, donut-shaped clouds of radiation?

Here's what you need to know.
1. The radiation belts are a side effect of Earth's magnetic field

The Van Allen radiation belts exist because fast-moving charged particles get trapped inside Earth's natural magnetic field, forming two concentric donut-shaped clouds of radiation. Other planets with global magnetic fields, like Jupiter, also have radiation belts.
2. The radiation belts were one of our first Space Age discoveries

Earth's radiation belts were first identified in 1958 by Explorer 1, the first U.S. satellite. The inner belt, composed predominantly of protons, and the outer belt, mostly electrons, would come to be named the Van Allen Belts, after James Van Allen, the scientist who led the charge designing the instruments and studying the radiation data from Explorer 1.
3. The Van Allen Probes have spent six years exploring the radiation belts

In 2012, we launched the twin Van Allen Probes to study the radiation belts. Over the past six years, these spacecraft have orbited in and out of the belts, providing brand-new data about how the radiation belts shift and change in response to solar activity and other factors.
4. Surprise! Sometimes there are three radiation belts

Shortly after launch, the Van Allen Probes detected a previously-unknown third radiation belt, created by a bout of strong solar activity. All the extra energy directed towards Earth meant that some particles trapped in our planet's magnetic field were swept out into the usually relatively empty region between the two Van Allen Belts, creating an additional radiation belt.
5. Swan song for the Van Allen Probes

Originally designed for a two-year mission, the Van Allen Probes have spent more than six years collecting data in the harsh radiation environment of the Van Allen Belts. In spring 2019, we're changing their orbit to bring the perigee — the part of the orbit where the spacecraft are closest to Earth — about 190 miles lower. This ensures that the spacecraft will eventually burn up in Earth's atmosphere, instead of orbiting forever and becoming space junk.
Because the Van Allen Probes have proven to be so hardy, they'll continue collecting data throughout the final months of the mission until they run out of fuel. As they skim through the outer reaches of Earth's atmosphere, scientists and engineers will also learn more about how atmospheric oxygen can degrade satellite measurements — information that can help build better satellites in the future.
Keep up with the latest on the mission on Twitter, Facebook or nasa.gov/vanallenprobes.
Meet Fermi: Our Eyes on the Gamma-Ray Sky
Black holes, cosmic rays, neutron stars and even new kinds of physics — for 10 years, data from our Fermi Gamma-ray Space Telescope have helped unravel some of the biggest mysteries of the cosmos. And Fermi is far from finished!

On June 11, 2008, at Cape Canaveral in Florida, the countdown started for Fermi, which was called the Gamma-ray Large Area Space Telescope (GLAST) at the time.
The telescope was renamed after launch to honor Enrico Fermi, an Italian-American pioneer in high-energy physics who also helped develop the first nuclear reactor.
Fermi has had many other things named after him, like Fermi’s Paradox, the Fermi National Accelerator Laboratory, the Enrico Fermi Nuclear Generating Station, the Enrico Fermi Institute, and the synthetic element fermium.

Photo courtesy of Argonne National Laboratory
The Fermi telescope measures some of the highest energy bursts of light in the universe; watching the sky to help scientists answer all sorts of questions about some of the most powerful objects in the universe.
Its main instrument is the Large Area Telescope (LAT), which can view 20% of the sky at a time and makes a new image of the whole gamma-ray sky every three hours. Fermi’s other instrument is the Gamma-ray Burst Monitor. It sees even more of the sky at lower energies and is designed to detect brief flashes of gamma-rays from the cosmos and Earth.

This sky map below is from 2013 and shows all of the high energy gamma rays observed by the LAT during Fermi’s first five years in space. The bright glowing band along the map’s center is our own Milky Way galaxy!

So what are gamma rays?
Well, they’re a form of light. But light with so much energy and with such short wavelengths that we can’t see them with the naked eye. Gamma rays require a ton of energy to produce — from things like subatomic particles (such as protons) smashing into each other.
Here on Earth, you can get them in nuclear reactors and lightning strikes. Here’s a glimpse of the Seattle skyline if you could pop on a pair of gamma-ray goggles. That purple streak? That’s still the Milky Way, which is consistently the brightest source of gamma rays in our sky.

In space, you find that kind of energy in places like black holes and neutron stars. The raindrop-looking animation below shows a big flare of gamma rays that Fermi spotted coming from something called a blazar, which is a kind of quasar, which is different from a pulsar... actually, let’s back this up a little bit.

One of the sources of gamma rays that Fermi spots are pulsars. Pulsars are a kind of neutron star, which is a kind of star that used to be a lot bigger, but collapsed into something that’s smaller and a lot denser. Pulsars send out beams of gamma rays. But the thing about pulsars is that they rotate.
So Fermi only sees a beam of gamma rays from a pulsar when it’s pointed towards Earth. Kind of like how you only periodically see the beam from a lighthouse. These flashes of light are very regular. You could almost set your watch by them!

Quasars are supermassive black holes surrounded by disks of gas. As the gas falls into the black hole, it releases massive amount of energy, including — you guessed it — gamma rays. Blazars are quasars that send out beams of gamma rays and other forms of light — right in our direction.
When Fermi sees them, it’s basically looking straight down this tunnel of light, almost all the way back to the black hole. This means we can learn about the kinds of conditions in that environment when the rays were emitted. Fermi has found about 5,500 individual sources of gamma rays, and the bulk of them have been blazars, which is pretty nifty.

But gamma rays also have many other sources. We’ve seen them coming from supernovas where stars die and from star factories where stars are born. They’re created in lightning storms here on Earth, and our own Sun can toss them out in solar flares.
Gamma rays were in the news last year because of something Fermi spotted at almost the same time as the National Science Foundation (NSF)’s Laser Interferometer Gravitational-Wave Observatory (LIGO) and European Gravitational Observatory’s Virgo on August 17, 2017. Fermi, LIGO, Virgo, and numerous other observatories spotted the merger of two neutron stars. It was the first time that gravitational waves and light were confirmed to come from the same source.

Fermi has been looking at the sky for almost 10 years now, and it’s helped scientists advance our understanding of the universe in many ways. And the longer it looks, the more we’ll learn. Discover more about how we’ll be celebrating Fermi’s achievements all year.
Make sure to follow us on Tumblr for your regular dose of space: http://nasa.tumblr.com.
A Beginner’s Guide to Sustainable Aviation
Do you dream of catching a short flight between cities or journeying across the globe? The aviation industry currently makes up 2-3% of all carbon emissions, but the shift toward electric and hybrid aircraft will help tackle climate change and minimize the environmental impacts of commercial aviation.
Sustainable flight will revolutionize the way we travel. From battery-powered aircraft that reduce fuel consumption, to new lightweight materials that can improve safety and efficiency during flight, here are a few important things to know about the world of sustainable aviation, and what it takes to make air travel cleaner and safer for our planet.
What is Electrified Aircraft Propulsion?

Similar to electric or hybrid-electric cars, sustainable aircraft designs feature electric powertrain systems – the system of components that help propel an aircraft during flight – to help reduce fuel use and emissions. Electrified Aircraft Propulsion (EAP) systems let aircraft work using electric motors, and alternative fuels, rather than relying solely on traditional jet engines burning fossil fuels. At NASA, we’re developing innovative EAP technologies ranging from advanced electric machines designed to increase power and performance to new aircraft materials developed to minimize weight and reduce fuel usage.
What are the challenges with electrifying flight?


Unlike electric vehicles on the ground, electrified aircraft face greater challenges when managing weight and heat while they’re running. In order to ensure maximum efficiency and safety, aircraft components must be designed with minimal weight to help reduce the amount of drag slowing the plane down and causing excess fuel burn. Electrified aircraft must also have advanced thermal management systems to help transfer heat effectively, and ensure onboard systems are kept cool to avoid damage.
Our research and development of EAP technologies offer innovative solutions to these challenges. Designed to keep weight at a minimum, aircraft components such as the High Efficiency Megawatt Motor feature advanced technology that enable increased power and efficiency with three times less heat loss and weight than traditional aircraft motors. New material technologies such as electrical insulation also help transport heat more effectively to minimize heat buildup and are made of lightweight materials to ensure efficiency at high altitudes.
What are the benefits of sustainable aviation?

From an environmental perspective, aircraft electrification offers unique opportunities to lower global emissions and minimize reliance on fossil fuels. The introduction of hybrid- or fully electric aircraft will significantly reduce overall fuel consumption by generating power and thrust via electricity and electric motors. Lightweight EAP systems and components can also help improve aircraft efficiency and reduce fuel burn, while using non-conventional, alternative fuels can help reduce harmful emissions. From an economic standpoint, EAP technologies could help strengthen commercial airliner markets with aircraft designed for around 180 passengers. Green technologies can also benefit both airline companies and you when you fly by potentially reducing aircraft maintenance and in-flight energy costs, making air travel more affordable.
When will sustainable flight take off?

To help turn visions of eco-friendly air travel into reality, we’re teaming up with industry to test EAP technologies on aircraft and introduce them to the U.S. commercial aviation fleet no later than 2035.
Under our Electrified Powertrain Flight Demonstration (EPFD) project, we will conduct ground and flight tests using existing aircraft modified with EAP systems to assist in transitioning these technologies into commercial products. Flight demonstrations will also enable us to identify key risks and barriers associated with integrating new EAP systems into commercial airliners and develop new standards for future EAP aircraft as they take to the skies within the next decade.
There you have it: a quick glimpse into the world of sustainable aviation, and the shift towards keeping our skies cleaner and safer. As we embark on this journey, climb aboard and stay up to date on our latest technology developments and future flight demonstrations.
Make sure to follow us on Tumblr for your regular dose of space!


Image Credit:NASA/JPL-Caltech
In this large celestial mosaic, our Spitzer Space Telescope captured a stellar family portrait! You can find infants, parents and grandparents of star-forming regions all in this generational photo. There’s a lot to see in this image, including multiple clusters of stars born from the same dense clumps of gas and dust – some older and more evolved than others. Dive deeper into its intricacies by visiting https://go.nasa.gov/2XpiWLf
Make sure to follow us on Tumblr for your regular dose of space: http://nasa.tumblr.com.
Decoding Nebulae
We can agree that nebulae are some of the most majestic-looking objects in the universe. But what are they exactly? Nebulae are giant clouds of gas and dust in space. They’re commonly associated with two parts of the life cycle of stars: First, they can be nurseries forming new baby stars. Second, expanding clouds of gas and dust can mark where stars have died.

Not all nebulae are alike, and their different appearances tell us what's happening around them. Since not all nebulae emit light of their own, there are different ways that the clouds of gas and dust reveal themselves. Some nebulae scatter the light of stars hiding in or near them. These are called reflection nebulae and are a bit like seeing a street lamp illuminate the fog around it.

In another type, called emission nebulae, stars heat up the clouds of gas, whose chemicals respond by glowing in different colors. Think of it like a neon sign hanging in a shop window!

Finally there are nebulae with dust so thick that we’re unable to see the visible light from young stars shine through it. These are called dark nebulae.

Our missions help us see nebulae and identify the different elements that oftentimes light them up.
The Hubble Space Telescope is able to observe the cosmos in multiple wavelengths of light, ranging from ultraviolet, visible, and near-infrared. Hubble peered at the iconic Eagle Nebula in visible and infrared light, revealing these grand spires of dust and countless stars within and around them.

The Chandra X-ray Observatory studies the universe in X-ray light! The spacecraft is helping scientists see features within nebulae that might otherwise be hidden by gas and dust when viewed in longer wavelengths like visible and infrared light. In the Crab Nebula, Chandra sees high-energy X-rays from a pulsar (a type of rapidly spinning neutron star, which is the crushed, city-sized core of a star that exploded as a supernova).

The James Webb Space Telescope will primarily observe the infrared universe. With Webb, scientists will peer deep into clouds of dust and gas to study how stars and planetary systems form.

The Spitzer Space Telescope studied the cosmos for over 16 years before retiring in 2020. With the help of its detectors, Spitzer revealed unknown materials hiding in nebulae — like oddly-shaped molecules and soot-like materials, which were found in the California Nebula.

Studying nebulae helps scientists understand the life cycle of stars. Did you know our Sun got its start in a stellar nursery? Over 4.5 billion years ago, some gas and dust in a nebula clumped together due to gravity, and a baby Sun was born. The process to form a baby star itself can take a million years or more!

After billions more years, our Sun will eventually puff into a huge red giant star before leaving behind a beautiful planetary nebula (so-called because astronomers looking through early telescopes thought they resembled planets), along with a small, dense object called a white dwarf that will cool down very slowly. In fact, we don’t think the universe is old enough yet for any white dwarfs to have cooled down completely.
Since the Sun will live so much longer than us, scientists can't observe its whole life cycle directly ... but they can study tons of other stars and nebulae at different phases of their lives and draw conclusions about where our Sun came from and where it's headed. While studying nebulae, we’re seeing the past, present, and future of our Sun and trillions of others like it in the cosmos.

To keep up with the most recent cosmic news, follow NASA Universe on Twitter and Facebook.
Make sure to follow us on Tumblr for your regular dose of space.
Everyone (Even You!) Can Use Satellite Data
At NASA we’re pretty great at putting satellites and science instruments into orbit around Earth. But it turns out we’re also pretty great at showing people how to get and use all that data.
One of the top ways you can learn how to use NASA data is our ARSET program. ARSET is our Applied Remote Sensing Training program and it helps people build skills that integrate all these Earth science data into their decision making.

ARSET will train you on how to use data from a variety of Earth-observing satellites and instruments aboard the International Space Station.
Once you take a training, you’ll be in GREAT company because thousands of people have taken an ARSET training.

We hold in person and online trainings to people around the world, showing them how to use NASA Earth science data. Trainings are offered in air quality, climate, disaster, health, land, water resources and wildfire management.
For example, if you’re trying to track how much fresh drinking water there is in your watershed, you can take an ARSET training and learn how to find satellite data on how much precipitation has fallen over a certain time period or even things like the ‘moistness’ of soil and the quality of the water.

Best yet, all NASA Earth observing data is open and freely available to the whole world! That’s likely one of the reasons we’ve had participants from 172 of the approximately 190 countries on Earth.

Since its beginning 10 years ago, ARSET has trained more than 30 thousand people all over the world. They’ve also worked with people from more than 7,500 different organizations and that includes government agencies, non-profit groups, advocacy organizations, private industry.
And even though 2019 is ARSET’s 10th birthday – we’ve only just begun. Every year about 60% of the organizations and agencies we train are new to the program. We’re training just about anyone who is anyone doing Earth science on Earth!
Join us, learn more about how we train people to use Earth observing data here, and heck, you can even take a training yourself: https://arset.gsfc.nasa.gov/.
Make sure to follow us on Tumblr for your regular dose of space: http://nasa.tumblr.com
Solar System 10 Things: Two Years of Juno at Jupiter
Our Juno mission arrived at the King of Planets in July 2016. The intrepid robotic explorer has been revealing Jupiter's secrets ever since.
Here are 10 historic Juno mission highlights:

1. Arrival at a Colossus
After an odyssey of almost five years and 1.7 billion miles (2.7 billion kilometers), our Juno spacecraft fired its main engine to enter orbit around Jupiter on July 4, 2016. Juno, with its suite of nine science instruments, was the first spacecraft to orbit the giant planet since the Galileo mission in the 1990s. It would be the first mission to make repeated excursions close to the cloud tops, deep inside the planet’s powerful radiation belts.

2. Science, Meet Art
Juno carries a color camera called JunoCam. In a remarkable first for a deep space mission, the Juno team reached out to the general public not only to help plan which pictures JunoCam would take, but also to process and enhance the resulting visual data. The results include some of the most beautiful images in the history of space exploration.

3. A Whole New Jupiter
It didn’t take long for Juno—and the science teams who hungrily consumed the data it sent home—to turn theories about how Jupiter works inside out. Among the early findings: Jupiter's poles are covered in Earth-sized swirling storms that are densely clustered and rubbing together. Jupiter's iconic belts and zones were surprising, with the belt near the equator penetrating far beneath the clouds, and the belts and zones at other latitudes seeming to evolve to other structures below the surface.
4. The Ultimate Classroom
The Goldstone Apple Valley Radio Telescope (GAVRT) project, a collaboration among NASA, JPL and the Lewis Center for Educational Research, lets students do real science with a large radio telescope. GAVRT data includes Jupiter observations relevant to Juno, and Juno scientists collaborate with the students and their teachers.
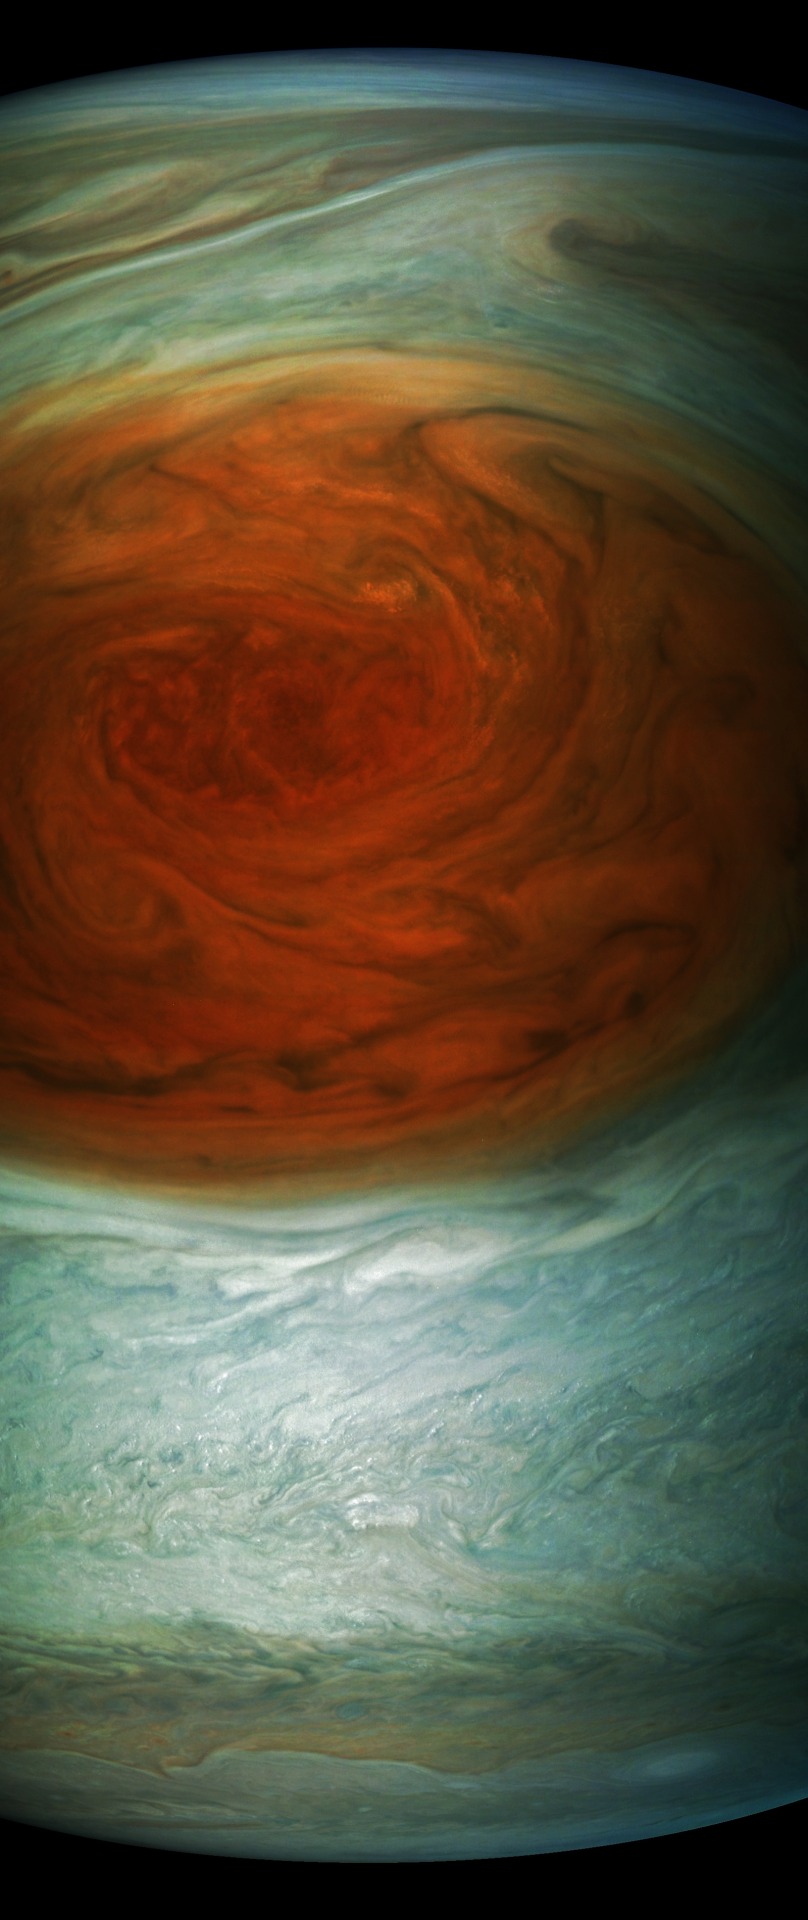
5. Spotting the Spot
Measuring in at 10,159 miles (16,350 kilometers) in width (as of April 3, 2017) Jupiter's Great Red Spot is 1.3 times as wide as Earth. The storm has been monitored since 1830 and has possibly existed for more than 350 years. In modern times, the Great Red Spot has appeared to be shrinking. In July 2017, Juno passed directly over the spot, and JunoCam images revealed a tangle of dark, veinous clouds weaving their way through a massive crimson oval.
“For hundreds of years scientists have been observing, wondering and theorizing about Jupiter’s Great Red Spot,” said Scott Bolton, Juno principal investigator from the Southwest Research Institute in San Antonio. “Now we have the best pictures ever of this iconic storm. It will take us some time to analyze all the data from not only JunoCam, but Juno’s eight science instruments, to shed some new light on the past, present and future of the Great Red Spot.”

6. Beauty Runs Deep
Data collected by the Juno spacecraft during its first pass over Jupiter's Great Red Spot in July 2017 indicate that this iconic feature penetrates well below the clouds. The solar system's most famous storm appears to have roots that penetrate about 200 miles (300 kilometers) into the planet's atmosphere.

7. Powerful Auroras, Powerful Mysteries
Scientists on the Juno mission observed massive amounts of energy swirling over Jupiter’s polar regions that contribute to the giant planet’s powerful auroras – only not in ways the researchers expected. Examining data collected by the ultraviolet spectrograph and energetic-particle detector instruments aboard Juno, scientists observed signatures of powerful electric potentials, aligned with Jupiter’s magnetic field, that accelerate electrons toward the Jovian atmosphere at energies up to 400,000 electron volts. This is 10 to 30 times higher than the largest such auroral potentials observed at Earth.
Jupiter has the most powerful auroras in the solar system, so the team was not surprised that electric potentials play a role in their generation. What puzzled the researchers is that despite the magnitudes of these potentials at Jupiter, they are observed only sometimes and are not the source of the most intense auroras, as they are at Earth.
8. Heat from Within
Juno scientists shared a 3D infrared movie depicting densely packed cyclones and anticyclones that permeate the planet’s polar regions, and the first detailed view of a dynamo, or engine, powering the magnetic field for any planet beyond Earth (video above). Juno mission scientists took data collected by the spacecraft’s Jovian InfraRed Auroral Mapper (JIRAM) instrument and generated a 3D fly-around of the Jovian world’s north pole.
Imaging in the infrared part of the spectrum, JIRAM captures light emerging from deep inside Jupiter equally well, night or day. The instrument probes the weather layer down to 30 to 45 miles (50 to 70 kilometers) below Jupiter's cloud tops.

9. A Highly Charged Atmosphere
Powerful bolts of lightning light up Jupiter’s clouds. In some ways its lightning is just like what we’re used to on Earth. In other ways,it’s very different. For example, most of Earth’s lightning strikes near the equator; on Jupiter, it’s mostly around the poles.

10. Extra Innings
In June, we approved an update to Juno’s science operations until July 2021. This provides for an additional 41 months in orbit around. Juno is in 53-day orbits rather than 14-day orbits as initially planned because of a concern about valves on the spacecraft’s fuel system. This longer orbit means that it will take more time to collect the needed science data, but an independent panel of experts confirmed that Juno is on track to achieve its science objectives and is already returning spectacular results. The spacecraft and all its instruments are healthy and operating nominally.
Read the full web version of this week’s ‘Solar System: 10 Things to Know’ article HERE.
For regular updates, follow NASA Solar System on Twitter and Facebook.
Make sure to follow us on Tumblr for your regular dose of space: http://nasa.tumblr.com
Perfect 10: A Decade of Studying Ice from the Sky
From 2009 through 2019, our Operation IceBridge flew planes above the Arctic, Antarctic and Alaska, measuring the height, depth, thickness, flow and change of sea ice, glaciers and ice sheets.

IceBridge was designed to “bridge” the years between NASA’s two Ice, Cloud, and land Elevation Satellites, ICESat and ICESat-2. IceBridge made its final polar flight in November 2019, one year after ICESat-2’s successful launch.
A lot of amazing science happens in a decade of fundamentally changing the way we see ice. Here, in chronological order, are 10 of IceBridge’s most significant and exciting achievements.
2009: Go for launch

The first ICESat monitored ice, clouds, atmospheric particles and vegetation globally beginning in 2003. As ICESat neared the end of its life, we made plans to keep measuring ice elevation with aircraft until ICESat-2’s launch.
ICESat finished its service in August 2009, leaving IceBridge in charge of polar ice tracking for the next decade.
2009: Snow on sea ice

To measure how thick sea ice is, we first have to know how much snow is accumulated on top of the ice. Using a snow radar instrument, IceBridge gathered the first widespread data set of snow thickness on top of both Arctic and Antarctic sea ice.
2009: Getting to the bottom of glaciers

IceBridge mapped hundreds of miles of grounding lines in both Antarctica and Greenland. Grounding lines are where a glacier’s bottom loses contact with the bedrock and begins floating on seawater – a grounding line that is higher than rock that the ice behind it is resting on increases the possibility of glaciers retreating in the future.
The team mapped 200 glaciers along Greenland’s coastal areas, as well as coastal areas, the interior of the Greenland Ice Sheet and high-priority areas in Antarctica.
2011: Spotting cracks in the ice

While flying Antarctica in 2011, IceBridge scientists spotted a massive crack in Pine Island Glacier, one of the fastest-changing glaciers on the continent. The crack produced a new iceberg that October.
Pine Island has grown thinner and more unstable in recent decades, spawning new icebergs almost every year. IceBridge watched for cracks that could lead to icebergs and mapped features like the deep water channel underneath Pine Island Glacier, which may bring warm water to its underside and make it melt faster.
2013: Making a map of rock

Using surface elevation, ice thickness and bedrock topography data from ICESat, IceBridge and international partners, the British Antarctic Survey created an updated map of the bedrock beneath Antarctic ice.
Taking gravity and magnetic measurements helps scientists understand what kind of rock lies below the ice sheet. Soft rock and meltwater make ice flow faster, while hard rock makes it harder for the ice to flow quickly.
2013: Surprises under the ice

IceBridge’s airborne radar data helped map the bedrock underneath the Greenland Ice Sheet, revealing a previously unknown canyon more than 400 miles long and up to a half mile deep slicing through the northern half of the country.
The “grand canyon” of Greenland may have once been a river system, and today likely transports meltwater from Greenland’s interior to the Arctic Ocean.
2015: It’s what’s inside (the ice sheet) that counts

After mapping the bedrock under the Greenland Ice Sheet, scientists turned their attention to the middle layers of the ice. Using both ice-penetrating radar and ice samples taken in the field, IceBridge created the first map of the ice sheet’s many layers, formed as thousands of years of snow became compacted downward and formed ice.
Making the 3D map of Greenland’s ice layers gave us clues as to how the ice sheet has warmed in the past, and where it may be frozen to bedrock or slowly melting instead.
2018: Gap bridged!

ICESat-2 launched on September 15, 2018, rocketing IceBridge into the final phase of its mission: Connecting ICESat and ICESat-2.
IceBridge continued flying after ICESat-2’s launch, working to verify the new satellite’s measurements. By conducting precise underflights, where planes traced the satellite’s orbit lines and took the same measurements at nearly the same time, the science teams could compare results and make sure ICESat-2’s instruments were functioning properly.
2018: An impact crater under the ice

Using IceBridge data, an international team of scientists found an impact crater from a meteor thousands of years in the past. The crater is larger than the city of Washington, D.C., likely created by a meteor more than half a mile wide.
2019: Flying into the sunset

In 2019, IceBridge continued flying in support of ICESat-2 for its Arctic and Antarctic campaigns. The hundreds of terabytes of data the team collected over the decade will fuel science for years to come.
IceBridge finished its last polar flight on November 20, 2019. The team will complete one more set of Alaska flights in 2020.
Make sure to follow us on Tumblr for your regular dose of space: http://nasa.tumblr.com
How hard is it to become an austronaut? I want to start to studie astrophysics and I don't know if I'll ever get any kind of job. Do you have any tips for people like me?
Astrophysics is a perfect field for pursuing any work at NASA! A degree in a STEM field is a requirement of becoming an astronaut, but other than that there are many possibilities. One of the best things about the astronaut office is its diversity. We are scientists, engineers, military pilots, flight test engineers, medical doctors, etc. etc. My biggest tip is to ensure you are pursuing what it is you are passionate about as that’s the only way to truly become exceptional at what you are doing, and most importantly, to be happy doing it. Passion, hard work, and dedication will get you there. Good luck!
-
 lovely-dellusions liked this · 3 years ago
 -
 vegetus-vox reblogged this · 3 years ago
 -
 scrumptioushairdoghostoperator liked this · 3 years ago
 -
 krislek liked this · 3 years ago
 -
 kaisgirlie liked this · 4 years ago
 -
 golotac liked this · 4 years ago
 -
 hobs-birb reblogged this · 4 years ago
 -
hobs-birb liked this · 4 years ago
-
 mega-mike-2-0 liked this · 4 years ago
 -
 cernunnos1990 reblogged this · 4 years ago
 -
cernunnos1990 liked this · 4 years ago
Explore the universe and discover our home planet with the official NASA Tumblr account
1K posts