I Was Looking At The GLOBE Observer Experiments For Citizens And Was Wondering How The Eclipse Affects
I was looking at the GLOBE Observer experiments for citizens and was wondering how the eclipse affects the cloud type? Or, I guess, why is that an important thing to measure? Thank you for answering our questions!
As my dad likes to say, I went to college to take up space, so I’m not sure what happens in the atmosphere. However, I think that the atmospheric scientists are interested in the types of waves that will be set up by the temperature gradients generated by the eclipse. So as totality occurs you get a very fast temperature drop in a localized area. I believe this can set up strong winds which may affect the type of clouds and/or their shapes. This is going to be the best-observed eclipse! And one thing I’ve learned as a scientist is that you never know what you’ll find in your data so collect as much of it as possible even if you aren’t sure what you’ll find. That is sometimes when you get the most exciting results! Thanks for downloading the app and helping to collect the data!
More Posts from Nasa and Others
What’s Up - June 2018
What’s Up For June?
Jupiter and Venus at sunset, Mars, Saturn and Vesta until dawn.

First up is Venus. It reaches its highest sunset altitude for the year this month and sets more than two hours after sunset.

You can't miss Jupiter, only a month after its opposition--when Earth was directly between Jupiter and the Sun.

The best time to observe Jupiter through a telescope is 10:30 p.m. at the beginning of the month and as soon as it's dark by the end of the month.

Just aim your binoculars at the bright planet for a view including the four Galilean moons. Or just enjoy Jupiter with your unaided eye!

Saturn is at opposition June 27th, when it and the Sun are on opposite sides of Earth. It rises at sunset and sets at sunrise. Great Saturn viewing will last several more months. The best views this month will be just after midnight.

All year, the rings have been tilted wide open--almost 26 degrees wide this month--giving us a great view of Saturn's distinctive rings.

The tilt offers us a view of the north polar region, so exquisitely imaged by the Cassini spacecraft.

Near Saturn, the brightest asteroid--Vesta--is so bright that it can be seen with your unaided eye. It will be visible for several months.

A detailed star chart will help you pick out the asteroid from the stars. The summer Milky way provides a glittery backdrop.

Finally, Mars grows dramatically in brightness and size this month and is visible by 10:30 p.m. by month end.

The best views are in the early morning hours. Earth's closest approach with Mars is only a month away. It's the closest Mars has been to us since 2003.

Watch the full What’s Up for June Video:
There are so many sights to see in the sky. To stay informed, subscribe to our What’s Up video series on Facebook. Make sure to follow us on Tumblr for your regular dose of space: http://nasa.tumblr.com.
Solar System 10 Things: Two Years of Juno at Jupiter
Our Juno mission arrived at the King of Planets in July 2016. The intrepid robotic explorer has been revealing Jupiter's secrets ever since.
Here are 10 historic Juno mission highlights:

1. Arrival at a Colossus
After an odyssey of almost five years and 1.7 billion miles (2.7 billion kilometers), our Juno spacecraft fired its main engine to enter orbit around Jupiter on July 4, 2016. Juno, with its suite of nine science instruments, was the first spacecraft to orbit the giant planet since the Galileo mission in the 1990s. It would be the first mission to make repeated excursions close to the cloud tops, deep inside the planet’s powerful radiation belts.

2. Science, Meet Art
Juno carries a color camera called JunoCam. In a remarkable first for a deep space mission, the Juno team reached out to the general public not only to help plan which pictures JunoCam would take, but also to process and enhance the resulting visual data. The results include some of the most beautiful images in the history of space exploration.

3. A Whole New Jupiter
It didn’t take long for Juno—and the science teams who hungrily consumed the data it sent home—to turn theories about how Jupiter works inside out. Among the early findings: Jupiter's poles are covered in Earth-sized swirling storms that are densely clustered and rubbing together. Jupiter's iconic belts and zones were surprising, with the belt near the equator penetrating far beneath the clouds, and the belts and zones at other latitudes seeming to evolve to other structures below the surface.
4. The Ultimate Classroom
The Goldstone Apple Valley Radio Telescope (GAVRT) project, a collaboration among NASA, JPL and the Lewis Center for Educational Research, lets students do real science with a large radio telescope. GAVRT data includes Jupiter observations relevant to Juno, and Juno scientists collaborate with the students and their teachers.
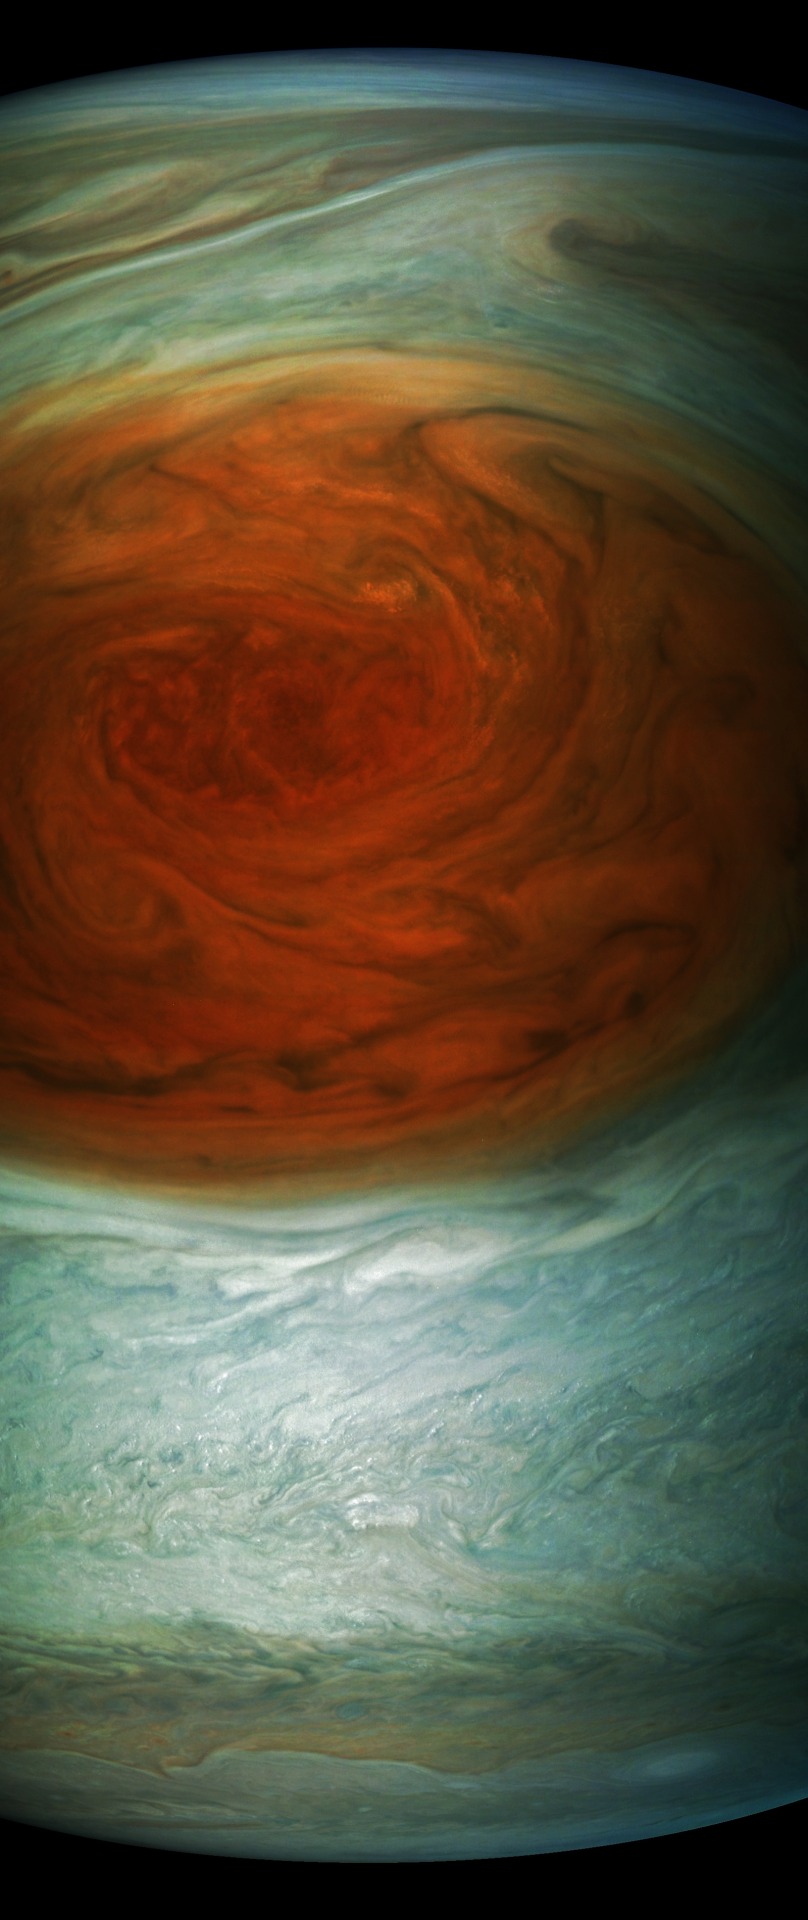
5. Spotting the Spot
Measuring in at 10,159 miles (16,350 kilometers) in width (as of April 3, 2017) Jupiter's Great Red Spot is 1.3 times as wide as Earth. The storm has been monitored since 1830 and has possibly existed for more than 350 years. In modern times, the Great Red Spot has appeared to be shrinking. In July 2017, Juno passed directly over the spot, and JunoCam images revealed a tangle of dark, veinous clouds weaving their way through a massive crimson oval.
“For hundreds of years scientists have been observing, wondering and theorizing about Jupiter’s Great Red Spot,” said Scott Bolton, Juno principal investigator from the Southwest Research Institute in San Antonio. “Now we have the best pictures ever of this iconic storm. It will take us some time to analyze all the data from not only JunoCam, but Juno’s eight science instruments, to shed some new light on the past, present and future of the Great Red Spot.”

6. Beauty Runs Deep
Data collected by the Juno spacecraft during its first pass over Jupiter's Great Red Spot in July 2017 indicate that this iconic feature penetrates well below the clouds. The solar system's most famous storm appears to have roots that penetrate about 200 miles (300 kilometers) into the planet's atmosphere.

7. Powerful Auroras, Powerful Mysteries
Scientists on the Juno mission observed massive amounts of energy swirling over Jupiter’s polar regions that contribute to the giant planet’s powerful auroras – only not in ways the researchers expected. Examining data collected by the ultraviolet spectrograph and energetic-particle detector instruments aboard Juno, scientists observed signatures of powerful electric potentials, aligned with Jupiter’s magnetic field, that accelerate electrons toward the Jovian atmosphere at energies up to 400,000 electron volts. This is 10 to 30 times higher than the largest such auroral potentials observed at Earth.
Jupiter has the most powerful auroras in the solar system, so the team was not surprised that electric potentials play a role in their generation. What puzzled the researchers is that despite the magnitudes of these potentials at Jupiter, they are observed only sometimes and are not the source of the most intense auroras, as they are at Earth.
8. Heat from Within
Juno scientists shared a 3D infrared movie depicting densely packed cyclones and anticyclones that permeate the planet’s polar regions, and the first detailed view of a dynamo, or engine, powering the magnetic field for any planet beyond Earth (video above). Juno mission scientists took data collected by the spacecraft’s Jovian InfraRed Auroral Mapper (JIRAM) instrument and generated a 3D fly-around of the Jovian world’s north pole.
Imaging in the infrared part of the spectrum, JIRAM captures light emerging from deep inside Jupiter equally well, night or day. The instrument probes the weather layer down to 30 to 45 miles (50 to 70 kilometers) below Jupiter's cloud tops.

9. A Highly Charged Atmosphere
Powerful bolts of lightning light up Jupiter’s clouds. In some ways its lightning is just like what we’re used to on Earth. In other ways,it’s very different. For example, most of Earth’s lightning strikes near the equator; on Jupiter, it’s mostly around the poles.

10. Extra Innings
In June, we approved an update to Juno’s science operations until July 2021. This provides for an additional 41 months in orbit around. Juno is in 53-day orbits rather than 14-day orbits as initially planned because of a concern about valves on the spacecraft’s fuel system. This longer orbit means that it will take more time to collect the needed science data, but an independent panel of experts confirmed that Juno is on track to achieve its science objectives and is already returning spectacular results. The spacecraft and all its instruments are healthy and operating nominally.
Read the full web version of this week’s ‘Solar System: 10 Things to Know’ article HERE.
For regular updates, follow NASA Solar System on Twitter and Facebook.
Make sure to follow us on Tumblr for your regular dose of space: http://nasa.tumblr.com
10 Ways to Celebrate Halloween with NASA
There’s a whole universe of mysteries out there to put some fun—and maybe a touch of fright—into your All Hallows Eve festivities. Here are a few:
1. Universe of Monsters
Mythical monsters of Earth have a tough time of it. Vampires don’t do sunlight. Werewolves must wait for a full Moon to howl. Now, thanks to powerful space telescopes, some careful looking and a lot of whimsy, NASA scientists have found suitable homes for the most terrifying Halloween monsters.

2. Be a Spacecraft
No costume. No problem. NASA Blueshift offers some handy tips on transforming yourself into a powerful space telescope before hitting the sidewalk to trick-or-treat.

3. Robot Pumpkins
At Halloween, engineers at NASA’s Jet Propulsion Laboratory craft dramatic creations that have as much in common with standard jack-o'-lanterns as paper airplanes do with NASA spacecraft. The unofficial pumpkin carving contest gives engineers a chance to flex their creative muscles and bond as a team. The rules are simple: no planning, carving or competing during work hours.
The results? See for yourself!
Can’t wait to see this year’s creations? Do it yourself!


4. Skull Comet
Scientists think a large space rock that zipped past Earth on Halloween in 2015 was most likely a dead comet or an asteroid that, fittingly, bore an eerie resemblance to a skull.
"The object might be a dead comet, but in the (radar) images it appears to have donned a skull costume for its Halloween flyby," said NASA scientist Kelly Fast,
As with a lot of spooky things, the asteroid looked a lot less scary upon closer inspection.

5. Spooky Sun
Not to be outdone, the Sun—our star—has been known to put on a scary face.
In this October 2014 Solar Dynamic Observatory image, active regions on the Sun combined to look something like a jack-o-lantern’s face.
The active regions appear brighter because those are areas that emit more light and energy—markers of an intense and complex set of magnetic fields hovering in the Sun’s atmosphere, the corona. This image blends together two sets of wavelengths at 171 and 193 angstroms, typically colorized in gold and yellow, to create a particularly Halloween-like appearance.

6. Halloween on a Mission
Halloween held a special significance for NASA’s Cassini mission, which launched in October 1997. The team held its own elaborate pumpkin carving competitions for many years. The mission also shared whimsical Halloween greetingswith its home planet.
Cassini ended its extended mission at Saturn in 2017.

7. The Ghost of Cassiopeia
The brightest stars embedded in nebulae throughout our galaxy pour out a torrent of radiation that eats into vast clouds of hydrogen gas – the raw material for building new stars. This etching process sculpts a fantasy landscape where human imagination can see all kinds of shapes and figures. This nebula in the constellation of Cassiopeia has flowing veils of gas and dust that have earned it the nickname "Ghost Nebula."

8. They’re Everywhere
Turns out the human mind—including space scientists and engineers among us—find spooky shapes in many places.
This infrared view of the Helix Nebula reminded astronomers of a zombie eyeball.

9. What Do You See?
The Oct. 26 Earth Observatory’s Puzzler feature offers a spooky shape for your consideration. What is it and what does it look like? You tell us.

10. Space Candy
The trick-or-treat tradition is still—so far—pretty much confined to Earth. But thanks to the men and women who have been living aboard the International Space Station for more than 17 years, we have a preview of what a future space-based trick-or-treater’s Halloween candy haul would look like in microgravity.

Bonus: 11. Want More?
Our education team offers a bunch more Halloween activities, including space-themed pumpkin stencils, costume tips and even some mysteries to solve like a scientist or engineer.

Make sure to follow us on Tumblr for your regular dose of space: http://nasa.tumblr.com.
6 Ways NASA is Involved in Climate Science
When it comes to climate change, we play a unique role in observing and understanding changes to the planet. Thanks to NASA’s Earth observations and related research, we know our planet and its climate are changing profoundly. We also know human activities, like releasing carbon dioxide and methane into the atmosphere, are driving this change.
Not only do we make these observations, we help people and groups use this knowledge to benefit society. The work we do at NASA is critical to helping us understand the ways our planet is responding to increased temperatures.

Here are 6 ways that we are involved in climate science and informing decisions:
1. Monitoring Earth’s vital signs
Just like a doctor checks your vitals when you go in for a visit, here at NASA we are constantly monitoring Earth’s vital signs - carbon dioxide levels, global temperature, Arctic sea ice minimum, the ice sheets and sea level, and more.

We use satellites in space, observations from airplanes and ships, and data collected on the ground to understand our planet and its changing climate. Scientists also use computers to model and understand what's happening now and what might happen in the future.

People who study Earth see that the planet’s climate is getting warmer. Earth's temperature has gone up more than 1 degree Celsius (~2 degrees Fahrenheit) in the last 100 years. This may not seem like much, but small changes in Earth's temperature can have big effects. The current warming trend is of particular significance, because it is predominantly the result of human activity since the mid-20th century and is proceeding at an unprecedented rate.

People drive cars. People heat and cool their houses. People cook food. All those things take energy. Human-produced greenhouse gas emissions are largely responsible for warming our planet. Burning fossil fuels -- which includes coal, oil, and natural gas -- releases greenhouse gases such as carbon dioxide into the atmosphere, where they act like an insulating blanket and trap heat near Earth’s surface.
At NASA, we use satellites and instruments on board the International Space Station to confirm measurements of atmospheric carbon levels. They’ve been increasing much faster than any other time in history.

2. Tracking global land use and its impacts
We also monitor and track global land use. Currently, half the world's population lives in urban areas, and by 2025, the United Nations projects that number will rise to 60%.

With so many people living and moving to metropolitan areas, the scientific world recognizes the need to study and understand the impacts of urban growth both locally and globally.

The International Space Station helps with this effort to monitor Earth. Its position in low-Earth orbit provides variable views and lighting over more than 90% of the inhabited surface of Earth, a useful complement to sensor systems on satellites in higher-altitude polar orbits. This high-resolution imaging of land and sea allows tracking of urban and forest growth, monitoring of hurricanes and volcanic eruptions, documenting of melting glaciers and deforestation, understanding how agriculture may be impacted by water stress, and measuring carbon dioxide in Earth’s atmosphere.
3. Research into the causes of climate change
Being able to monitor Earth’s climate from space also allows us to understand what’s driving these changes.

With the CERES instruments, which fly on multiple Earth satellites, our scientists measure the Earth’s planetary energy balance – the amount of energy Earth receives from the Sun and how much it radiates back to space. Over time, less energy being radiated back to space is evidence of an increase in Earth’s greenhouse effect. Human emissions of greenhouse gases are trapping more and more heat.

NASA scientists also use computer models to simulate changes in Earth’s climate as a result of human and natural drivers of temperature change.

These simulations show that human activities such as greenhouse gas emissions, along with natural factors, are necessary to simulate the changes in Earth’s climate that we have observed; natural forces alone can’t do so.
4. Research into the effects of climate change
Global climate change has already had observable effects on the environment. Glaciers and ice sheets have shrunk, ice on rivers and lakes is breaking up earlier, plant and animal ranges have shifted, and trees are flowering sooner.

The effects of global climate change that scientists predicted are now occurring: loss of sea ice, accelerated sea level rise and longer, more intense heat waves.
Climate modelers have predicted that, as the planet warms, Earth will experience more severe heat waves and droughts, larger and more extreme wildfires, and longer and more intense hurricane seasons on average. The events of 2020 are consistent with what models have predicted: extreme climate events are more likely because of greenhouse gas emissions.

Plants are also struggling to keep up with rising carbon dioxide levels. Plants play a key role in mitigating climate change. The more carbon dioxide they absorb during photosynthesis, the less carbon dioxide remains trapped in the atmosphere where it can cause temperatures to rise. But scientists have identified an unsettling trend – 86% of land ecosystems globally are becoming progressively less efficient at absorbing the increasing levels of carbon dioxide from the atmosphere.
Helping organizations to use all the data and knowledge NASA generates is another part of our job. We’ve helped South Dakota fight West Nile Virus, helped managers across the Western U.S. handle water, helped The Nature Conservancy protect land for shorebirds, and others. We also support developing countries as they work to address climate and other challenges through a 15-year partnership with the United States Agency for International Development.
5. Action on sustainability
Sustainability involves taking action now to enable a future where the environment and living conditions are protected and enhanced. We work with many government, nonprofit, and business partners to use our data and modeling to inform their decisions and actions. We are also working to advance technologies for more efficient flight, including hybrid-electric propulsion, advanced materials, artificial intelligence, and machine learning.

These advances in research and technology will not only bring about positive changes to the climate and the world in which we live, but they will also drive the economic engine of America and our partners in industry, to remain the world-wide leader in flight development.
We partner with the private sector to facilitate the transfer of our research and NASA-developed technologies. Many innovations originally developed for use in the skies above help make life more sustainable on Earth. For example:
Our Earth-observing satellites help farmers produce more with less water.
Expertise in rocket engineering led to a technique that lessens the environmental impact of burning coal.
A fuel cell that runs equipment at oil wells reduces the need to vent greenhouse gases.
6. Applying climate research to preserve NASA centers in coastal areas
Sea level rise in the two-thirds of Earth covered by water may jeopardize up to two-thirds of NASA's infrastructure built within mere feet of sea level.

Some NASA centers and facilities are located in coastal real estate because the shoreline is a safer, less inhabited surrounding for launching rockets. But now these launch pads, laboratories, airfields, and testing facilities are potentially at risk because of sea level rise. We’ve worked internally at NASA to identify climate risks and support planning at our centers.
NASA Climate Science
Climate change is one of the most complex issues facing us today. It involves many dimensions – science, economics, society, politics, and moral and ethical questions – and is a global problem, felt on local scales, that will be around for decades and centuries to come. With our Eyes on the Earth and wealth of knowledge on the Earth’s climate system and its components, we are one of the world’s experts in climate science.
Visit our Climate site to explore and learn more.
Make sure to follow us on Tumblr for your regular dose of space: http://nasa.tumblr.com
More than Just Dust in the Wind

From space, we can see a swirling brown mass making its way across the Atlantic – dust from the Sahara Desert – the largest hot desert in the world. It’s a normal phenomenon. Every year, winds carry millions of tons of dust from North Africa, usually during spring and summer in the Northern Hemisphere.

June 2020 has seen a massive plume of dust crossing the ocean. It’s so large it’s visible from one million miles away in space.

Dust clouds this large can affect air quality in regions where the dust arrives. The particles can also scatter the Sun’s light, making sunrises and sunsets more vibrant.

Dust particles in the air are also known as aerosols. We can measure aerosols, including dust, sea salt and smoke, from satellites and also use computer models to study how they move with the wind.

Following the transport of dust from space shows us how one of the driest places on Earth plays a role in fertilizing the Amazon rainforest. There are minerals in Saharan dust, like phosphorous, that exist in commercial fertilizers, helping seed the rainforest.
Make sure to follow us on Tumblr for your regular dose of space: http://nasa.tumblr.com
That's one small bite for a man, one giant leaf for mankind: Today, astronauts Scott Kelly, Kjell Lindgren and Kimiya Yui of Japan sample the fruits of their labor after harvesting a crop of "Outredgeous" red romaine lettuce from the Veggie plant growth system on the International Space Station. They are the first people to eat food grown in space.
We’re maturing Veggie technology aboard the space station to provide future pioneers with a sustainable food supplement – a critical part of our Journey to Mars. As we move toward long-duration exploration missions farther into the solar system, Veggie will be a resource for crew food growth and consumption. It also could be used by astronauts for recreational gardening activities during deep space missions.
First piece of Orion’s Artemis III pressure vessel arrives at NASA’s Michoud Assembly Facility in New Orleans. https://blogs.nasa.gov/artemis/2020/08/25/first-piece-of-artemis-iii-orion-delivered-to-nasa/
The 2017 Atlantic Hurricane Season: What We Learned

The 2017 Atlantic hurricane season was among the top ten most active seasons in recorded history. Our experts are exploring what made this year particularly active and the science behind some of the biggest storms to date.

After a period of 12 years without a Category 3 or higher hurricane making landfall in the U.S., Hurricane Harvey made landfall over Texas as a Category 4 hurricane this August.
Harvey was also the biggest rainfall event ever to hit the continental U.S. with estimates more than 49 inches of rain.

Data like this from our Global Precipitation Measurement Mission, which shows the amount of rainfall from the storm and temperatures within the story, are helping scientists better understand how storms develop.

The unique vantage point of satellites can also help first responders, and this year satellite data helped organizations map out response strategies during hurricanes Harvey, Irma and Maria.

In addition to satellites, we use ground stations and aircraft to track hurricanes.

We also use the capabilities of satellites like Suomi NPP and others that are able to take nighttime views. In this instance, we were able to view the power outages in Puerto Rico. This allowed first responders to see where the location of impacted urban areas.

The combined effort between us, NOAA, FEMA and other federal agencies helps us understand more about how major storms develop, how they gain strength and how they affect us.

To learn more about how we study storms, go to www.nasa.gov/Hurricanes.
Make sure to follow us on Tumblr for your regular dose of space: http://nasa.tumblr.com.
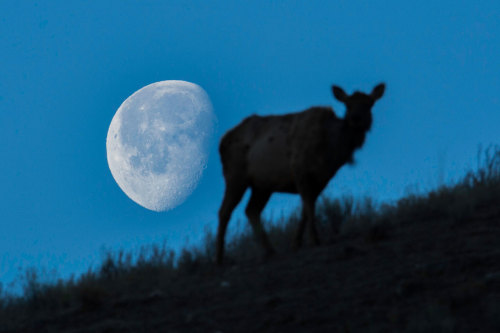
Our friend - the Moon - is putting on a show tonight!
Look to the sky at 12:44 a.m. EDT to see the first full Moon of summer in the Northern Hemisphere and a partial penumbral eclipse, visible from most of North America. Want more info on this special occurrence? click HERE.
Make sure to follow us on Tumblr for your regular dose of space: http://nasa.tumblr.com
What's Up? - May 2018

What’s Up For May?
The Moon and Saturn meet Mars in the morning as our InSight spacecraft launches to the Red Planet on May 5!

You won't want to miss red Mars in the southern morning skies this month.

InSight, our first mission to explore Mars' deep interior, launches on May 5th with a launch window that begins at 4:05 a.m. PDT and lasts for two hours.

Some lucky viewers in central and southern California and even parts of the Mexican Pacific coast will get a chance to see the spacecraft launch with their unaided eyes AND its destination, Mars, at the same time.

Mars shines a little brighter than last month, as it approaches opposition on July 27th. That's when Mars and the Sun will be on opposite sides of the Earth. This will be Mars' closest approach to Earth since 2003!

Compare the planet's increases in brightness with your own eyes between now and July 27th.

The Eta Aquarid meteor shower will be washed out by the Moon this month, but if you are awake for the InSight launch anyway, have a look. This shower is better viewed from the southern hemisphere, but medium rates of 10 to 30 meteors per hour MAY be seen before dawn.

Of course, you could travel to the South Pacific to see the shower at its best!

There's no sharp peak to this shower--just several nights with good rates, centered on May 6th.

Jupiter reaches opposition on May 9th, heralding the best Jupiter-observing season, especially for mid-evening viewing. That's because the king of the planets rises at sunset and sets at dawn.

Wait a few hours after sunset, when Jupiter is higher in the sky, for the best views. If you viewed Jupiter last month, expect the view to be even better this month!
Watch the full What’s Up for May Video:
There are so many sights to see in the sky. To stay informed, subscribe to our What’s Up video series on Facebook. Make sure to follow us on Tumblr for your regular dose of space: http://nasa.tumblr.com.
-
 john-erby liked this · 3 years ago
 -
 2reputationpegacorns liked this · 3 years ago
 -
 bethelnie-blog liked this · 5 years ago
 -
 lucmarcou liked this · 5 years ago
 -
 toasterunderthesea liked this · 6 years ago
 -
 aquariana131 liked this · 6 years ago
 -
 thisisywedonteatbugs liked this · 6 years ago
 -
 finasblog reblogged this · 7 years ago
 -
 lxlteo liked this · 7 years ago
 -
 rjpetsupplies-blog liked this · 7 years ago
 -
 sorryimstudyin-blog1 liked this · 7 years ago
 -
 jamesjeonsworld liked this · 7 years ago
 -
 honeyandsunflower liked this · 7 years ago
 -
 freeandwilddragonfly liked this · 7 years ago
 -
 taebun liked this · 7 years ago
 -
 moraine-moraine liked this · 7 years ago
 -
 rainbow-demon503 liked this · 7 years ago
 -
 raptorwithamarker liked this · 7 years ago
 -
poporano liked this · 7 years ago
-
 memoriesbecomesongs liked this · 7 years ago
 -
 pankaj1995-blog liked this · 7 years ago
 -
 sirenamorena6 reblogged this · 7 years ago
 -
sirenamorena6 liked this · 7 years ago
-
 girlwhocandraw-blog liked this · 7 years ago
 -
 sahu liked this · 7 years ago
 -
 mafep-07-blog liked this · 7 years ago
 -
 cakemonster95 liked this · 7 years ago
 -
 akitolino liked this · 7 years ago
 -
 dj-nobiwan liked this · 7 years ago
 -
 mountains-more-like-nothings liked this · 7 years ago
 -
 mrsspooky liked this · 7 years ago
 -
 ask-sheban-command-blog liked this · 7 years ago
 -
 mlmiii liked this · 7 years ago
 -
 starlit-goose liked this · 7 years ago
 -
 wallgrenjan liked this · 7 years ago
 -
 sunsetruins liked this · 7 years ago
 -
 mayairvincoolkid-blog liked this · 7 years ago
 -
 glayaang-blog liked this · 7 years ago
 -
 aporetic-elf liked this · 7 years ago
 -
andreursosp liked this · 7 years ago
-
 maroakem liked this · 7 years ago
 -
 celerymage liked this · 7 years ago
 -
 marina-belle liked this · 7 years ago
 -
 galaxystew liked this · 7 years ago
Explore the universe and discover our home planet with the official NASA Tumblr account
1K posts