@manishkumarmishra: How Does All This Work Benefit Us Back Here On Earth?
@manishkumarmishra: How does all this work benefit us back here on Earth?
More Posts from Nasa and Others

Six Answers to Questions You’re Too Embarrassed to Ask about the Hottest Year on Record
You may have seen the news that 2023 was the hottest year in NASA’s record, continuing a trend of warming global temperatures. But have you ever wondered what in the world that actually means and how we know?
We talked to some of our climate scientists to get clarity on what a temperature record is, what happened in 2023, and what we can expect to happen in the future… so you don’t have to!

1. Why was 2023 the warmest year on record?
The short answer: Human activities. The release of greenhouse gases like carbon dioxide and methane into the atmosphere trap more heat near Earth’s surface, raising global temperatures. This is responsible for the decades-long warming trend we’re living through.
But this year’s record wasn’t just because of human activities. The last few years, we’ve been experiencing the cooler phase of a natural pattern of Pacific Ocean temperatures called the El Niño Southern Oscillation (ENSO). This phase, known as La Niña, tends to cool temperatures slightly around the world. In mid-2023, we started to shift into the warmer phase, known as El Niño. The shift ENSO brought, combined with overall human-driven warming and other factors we’re continuing to study, pushed 2023 to a new record high temperature.

2. So will every year be a record now?
Almost certainly not. Although the overall trend in annual temperatures is warmer, there’s some year-to-year variation, like ENSO we mentioned above.
Think about Texas and Minnesota. On the whole, Texas is warmer than Minnesota. But some days, stormy weather could bring cooler temperatures to Texas while Minnesota is suffering through a local heat wave. On those days, the weather in Minnesota could be warmer than the weather in Texas. That doesn’t mean Minnesota is warmer than Texas overall; we’re just experiencing a little short-term variation.
Something similar happens with global annual temperatures. The globe will naturally shift back to La Niña in the next few years, bringing a slight cooling effect. Because of human carbon emissions, current La Niña years will be warmer than La Niña years were in the past, but they’ll likely still be cooler than current El Niño years.

3. What do we mean by “on record”?
Technically, NASA’s global temperature record starts in 1880. NASA didn’t exist back then, but temperature data were being collected by sailing ships, weather stations, and scientists in enough places around the world to reconstruct a global average temperature. We use those data and our modern techniques to calculate the average.
We start in 1880, because that’s when thermometers and other instruments became technologically advanced and widespread enough to reliably measure and calculate a global average. Today, we make those calculations based on millions of measurements taken from weather stations and Antarctic research stations on land, and ships and ocean buoys at sea. So, we can confidently say 2023 is the warmest year in the last century and a half.

However, we actually have a really good idea of what global climate looked like for tens of thousands of years before 1880, relying on other, indirect ways of measuring temperature. We can look at tree rings or cores drilled from ice sheets to reconstruct Earth’s more ancient climate. These measurements affirm that current warming on Earth is happening at an unprecedented speed.
4. Why does a space agency keep a record of Earth’s temperature?
It’s literally our job! When NASA was formed in 1958, our original charter called for “the expansion of human knowledge of phenomena in the atmosphere and space.” Our very first space missions uncovered surprises about Earth, and we’ve been using the vantage point of space to study our home planet ever since. Right now, we have a fleet of more than 20 spacecraft monitoring Earth and its systems.
Why we created our specific surface temperature record – known as GISTEMP – actually starts about 25 million miles away on the planet Venus. In the 1960s and 70s, researchers discovered that a thick atmosphere of clouds and carbon dioxide was responsible for Venus’ scorchingly hot temperatures.

Dr. James Hansen was a scientist at the Goddard Institute for Space Studies in New York, studying Venus. He realized that the greenhouse effect cooking Venus’ surface could happen on Earth, too, especially as human activities were pumping carbon dioxide into our atmosphere.
He started creating computer models to see what would happen to Earth’s climate as more carbon dioxide entered the atmosphere. As he did, he needed a way to check his models – a record of temperatures at Earth’s surface over time, to see if the planet was indeed warming along with increased atmospheric carbon. It was, and is, and NASA’s temperature record was born.
5. If last year was record hot, why wasn’t it very hot where I live?
The temperature record is a global average, so not everywhere on Earth experienced record heat. Local differences in weather patterns can influence individual locations to be hotter or colder than the globe overall, but when we average it out, 2023 was the hottest year.
Just because you didn’t feel record heat this year, doesn’t mean you didn’t experience the effects of a warming climate. 2023 saw a busy Atlantic hurricane season, low Arctic sea ice, raging wildfires in Canada, heat waves in the U.S. and Australia, and more.

And these effects don’t stay in one place. For example, unusually hot and intense fires in Canada sent smoke swirling across the entire North American continent, triggering some of the worst air quality in decades in many American cities. Melting ice at Earth’s poles drives rising sea levels on coasts thousands of miles away.

6. Speaking of which, why is the Arctic – one of the coldest places on Earth – red on this temperature map?
Our global temperature record doesn’t actually track absolute temperatures. Instead, we track temperature anomalies, which are basically just deviations from the norm. Our baseline is an average of the temperatures from 1951-1980, and we compare how much Earth’s temperature has changed since then.
Why focus on anomalies, rather than absolutes? Let’s say you want to track if apples these days are generally larger, smaller, or the same size as they were 20 years ago. In other words, you want to track the change over time.
Apples grown in Florida are generally larger than apples grown in Alaska. Like, in real life, how Floridian temperatures are generally much higher than Alaskan temperatures. So how do you track the change in apple sizes from apples grown all over the world while still accounting for their different baseline weights?
By focusing on the difference within each area rather than the absolute weights. So in our map, the Arctic isn’t red because it’s hotter than Bermuda. It’s red because it’s gotten relatively much warmer than Bermuda has in the same time frame.
Want to learn more about climate change? Dig into the data at climate.nasa.gov.
Make sure to follow us on Tumblr for your regular dose of space!
Will the James Webb Telescope also be able to spot out signs of life on habitable worlds?
Solar System: Things to Know This Week
Earlier this month, Mars was at opposition, which is the point in their orbits when Mars, Earth and the sun all line up, making for good conditions to view the Red Planet from Earth.
Now, it’s Saturn’s turn. The ringed planet will be at opposition on June 3, and this week is a great time to see it — both in the sky as well as up close, thanks to our spacecraft. Here are a few things to know about Saturn exploration this week:
1. Group Portrait

Thanks to their current orbital positions, our sun-observing spacecraft STEREO-A was recently able to capture the sun, Saturn, Mars and Earth in one image. Take a closer look HERE. Discover more about the STEREO mission HERE.
2. Likable, Lick-able Saturn

Saturn’s handsome visage is featured among the new stamps that the US Postal Service is releasing this week to highlight our adventures in planetary exploration.
3. Do You Even Know Saturn?

Yes, yes, it’s the one with the rings. But did you know Saturn has winds that can exceed 1000 miles per hour? Or that its magnetic field is hundreds of times as powerful as the Earth’s? Or that its day is just 10 hours long? How well do you really know the sixth planet?
4. Picking Up Signals

One thing you many not know about the planet is that it’s loud, at least if you listen to its radio signals. When our robotic Cassini spacecraft first approached Saturn, it detected the powerful fields that surround it. Engineers turned those signals into beautiful, eerie sounds. Listen to them HERE.
5. Not All Who Wander Are Lost

The Cassini mission’s explorations of the Saturn system are very much ongoing. In the next few days, the spacecraft will be touring many locations, including the giant moon Titan, Saturn’s turbulent clouds, the tiny moon Albiorix and more! Get the full itinerary HERE.
Want to learn more? Read our full list of the 10 things to know this week about the solar system HERE.
Make sure to follow us on Tumblr for your regular dose of space: http://nasa.tumblr.com
Hello Serena! I was wondering if given the chance would you be apart of a mission to mars in the near future, and if you could bring a personal item with you what would it be?
Meet the Artemis Team Returning Humans to the Moon
We. Are. Going 🌙
Today, we introduced the eighteen NASA Astronauts forming the Artemis team. Together, they'll use their diverse range of backgrounds, expertise, and experience to pave the way for humans to return to the Moon, to stay.
Meet the heroes of the future who'll carry us back to the Moon and beyond - the Artemis generation.
Joe Acaba

Fun fact: Joe is a veteran of the U.S. Peace Corps! Get to know Joe personally with this video –> Watch HERE.
Kayla Barron

Fun fact: Kayla got her start in public service through serving in the U.S. Navy. Get to know Kayla personally with this video –> Watch HERE.
Raja Chari

Fun fact: Raja’s nickname is “Grinder,” and he comes from a test pilot background. Get to know Raja personally with this video –> Watch HERE.
Jessica Watkins

Fun fact: Jessica is a rugby national champion winner and geologist. Get to know Jessica personally with this video –> Watch HERE.
Matthew Dominick

Fun fact: Matthew sums himself up as a father, a husband and an explorer. Get to know Matthew personally with this video –> Watch HERE.
Jasmin Moghbeli

Fun fact: Jasmin says she still wakes up every morning and it feels like a “pinch me moment” to think she’s actually an astronaut right now. Get to know Jasmin personally with this video –> Watch HERE.
Victor Glover

Fun fact: Victor’s dream is to work on the surface of the Moon. Get to know Victor personally with this video –> Watch HERE.
Jessica Meir

Fun fact: Jessica was five years old when she knew she wanted to be an astronaut. Get to know Jessica personally with this video –> Watch HERE.
Woody Hoburg

Fun fact: Woody used to spend summers away from graduate school working search and rescue in Yosemite National Park. Get to know Woody personally with this video –> Watch HERE.
Anne McClain

Fun fact: Anne is a West Point alumni who describes herself as an impractical dreamer. Get to know Anne personally with this video –> Watch HERE.
Jonny Kim

Fun fact: Jonny is also a U.S. Navy SEAL with a medical degree from Harvard. Get to know Jonny personally with this video –> Watch HERE.
Nicole Mann

Fun fact: Nicole is a U.S. Lieutenant Colonel in the Marine Corps! Get to know Nicole personally with this video –> Watch HERE.
Kjell Lindgren

Fun fact: Kjell was a flight surgeon, a physician who takes care of astronauts, before applying to be an astronaut himself! Get to know Kjell personally with this video –> Watch HERE.
Christina Koch

Fun fact: Christina set a record for the longest single spaceflight by a woman with a total of 328 days in space. Get to know Christina personally with this video –> Watch HERE.
Frank Rubio

Fun fact: Frank was a Black Hawk helicopter pilot in the U.S. Army and family medical physician. Get to know Frank personally with this video –> Watch HERE.
Stephanie Wilson

Fun fact: Stephanie was the voice in Mission Control leading our NASA Astronauts for the all-woman spacewalk last year. Get to know Stephanie personally with this video –> Watch HERE.
Scott Tingle

Fun fact: Scott said he wanted to be an astronaut in a high school class and the students laughed – look at him now. Get to know Scott personally with this video –> Watch HERE.
Kate Rubins

Fun fact: Kate is actually IN space right now, so she will have to get her official portrait when she comes home! She is also the first person to sequence DNA in space. Get to know Kate personally with this video –> Watch HERE. Stay up to date with our Artemis program and return to the Moon by following NASA Artemis on Twitter, Facebook and Instagram.
Make sure to follow us on Tumblr for your regular dose of space: http://nasa.tumblr.com.
Five Times Astronaut Peggy Whitson Made History
On April 24, 2017, NASA Astronaut Peggy Whitson established the new record for the most time spent in space by an American astronaut. She’s spent more than 76 weeks of her life floating in microgravity! It’s not the first time in her career at NASA that Whitson has established new milestones: here are just a few.

First NASA Science Officer
Peggy Whitson was the named the first NASA Science Officer aboard the space station in 2002. The position was created to work with the United States research community to understand and meet the requirements and objectives of each space station experiment.

First Female to Command the Space Station… Twice
Whitson became the first female to command the space station during Expedition 16 in 2008. Then Whitson became the first female to command the station twice during her current mission on April 9, 2017.

First Female Chief of the Astronaut Office
In 2009, Whitson became the first female and first non-pilot to achieve the most senior position for active astronauts, Chief of the Astronaut Office.
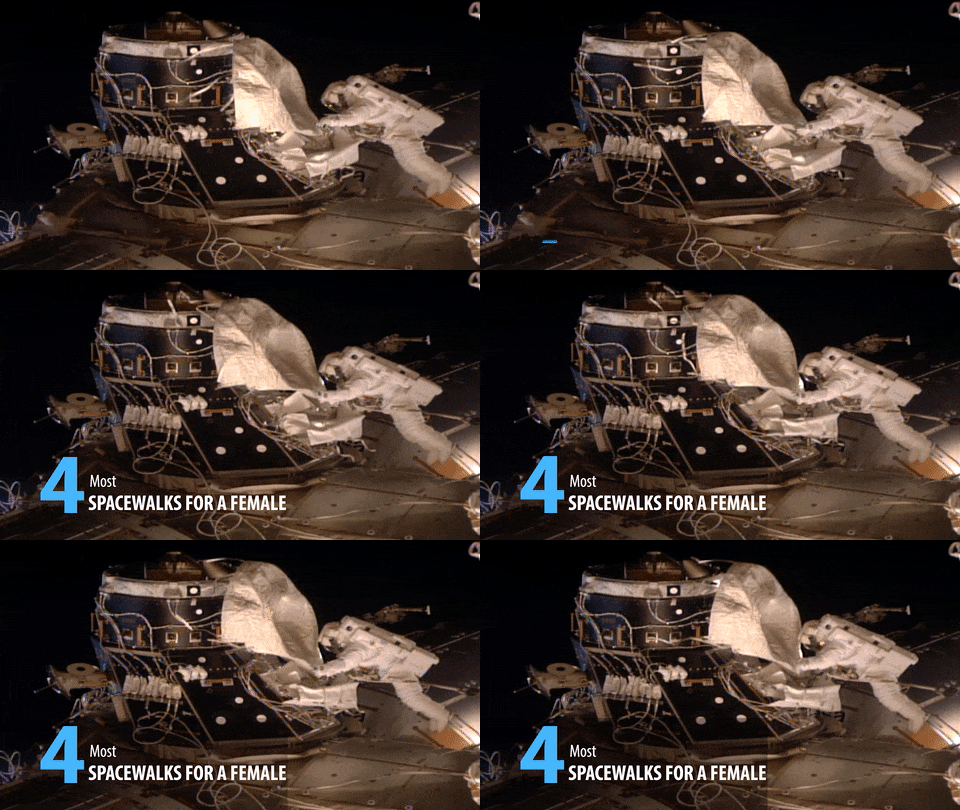
Most Spacewalks for a Female
On March 30, 2017, Peggy Whitson broke the record for most spacewalks and most time spent spacewalking for female astronauts. Suni Williams had previously held the record at 7 spacewalks.

Most Time In Space By A NASA Astronaut
At 1:27 a.m. ET on April 24, Peggy Whitson set the new record for cumulative time spent in space by an American astronaut. Jeff Williams previously set the record in 2016.
Make sure to follow us on Tumblr for your regular dose of space: http://nasa.tumblr.com

Deniz Burnham
A former NASA intern, Deniz Burnham started her career as an engineer on an oil rig in Prudhoe Bay, Alaska, and went on to lead operations on drilling rigs in Canada, Ohio, and Texas. https://go.nasa.gov/3wDpfBo
Make sure to follow us on Tumblr for your regular dose of space!
What exactly is a sun eclipse? Will I be able to see it and if so when from the Netherlands?
The solar eclipse is when the moon is directly in front of the Sun and creates a shadow on the Earth. They happen about once every 18 months. I don’t believe that you’ll be able to see this eclipse from the Netherlands. I think the next one to be in Europe is in 2026. There’s one in Chillie and Argentia in 2019 and another in Antartica in 2021.
What’s Up for November 2016
What’s Up for November: Venus at sunset, Jupiter at dawn, your last evening glimpse of Saturn until spring, and more meteors!

Through November 3, catch glimpses of a gibbous Venus, a crescent moon and ringed Saturn in the southwest sky just after sunset.

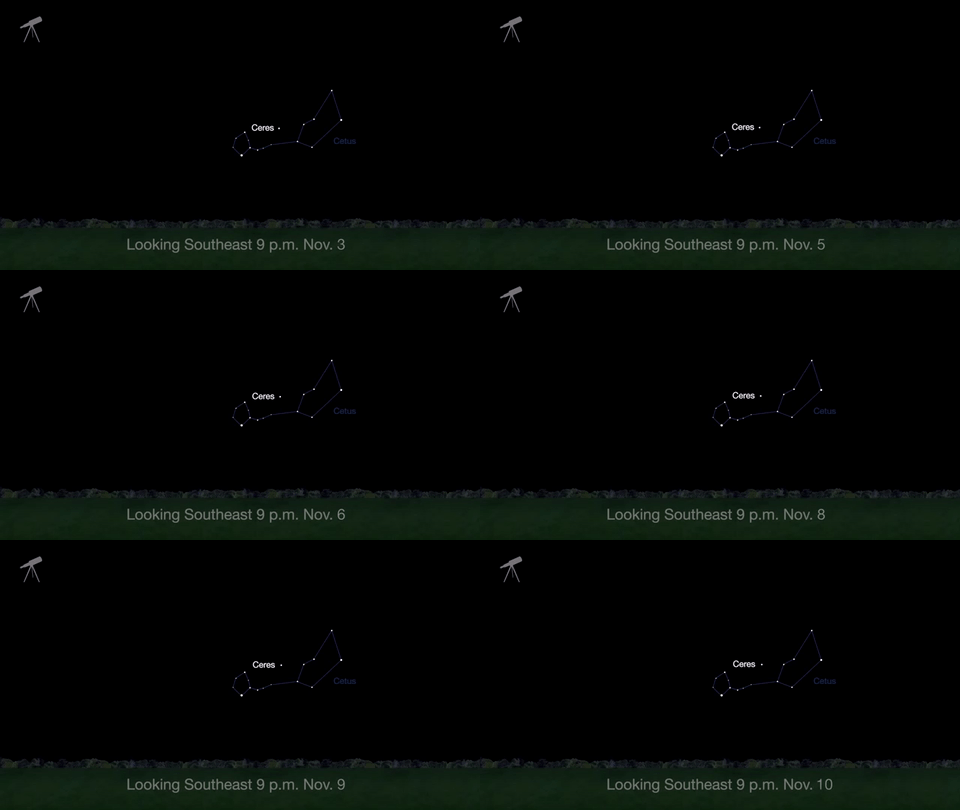
Wake up before sunrise every day this month to see Jupiter just above Spica, the brightest star in the constellation Virgo, shining in the east-southeast sky.
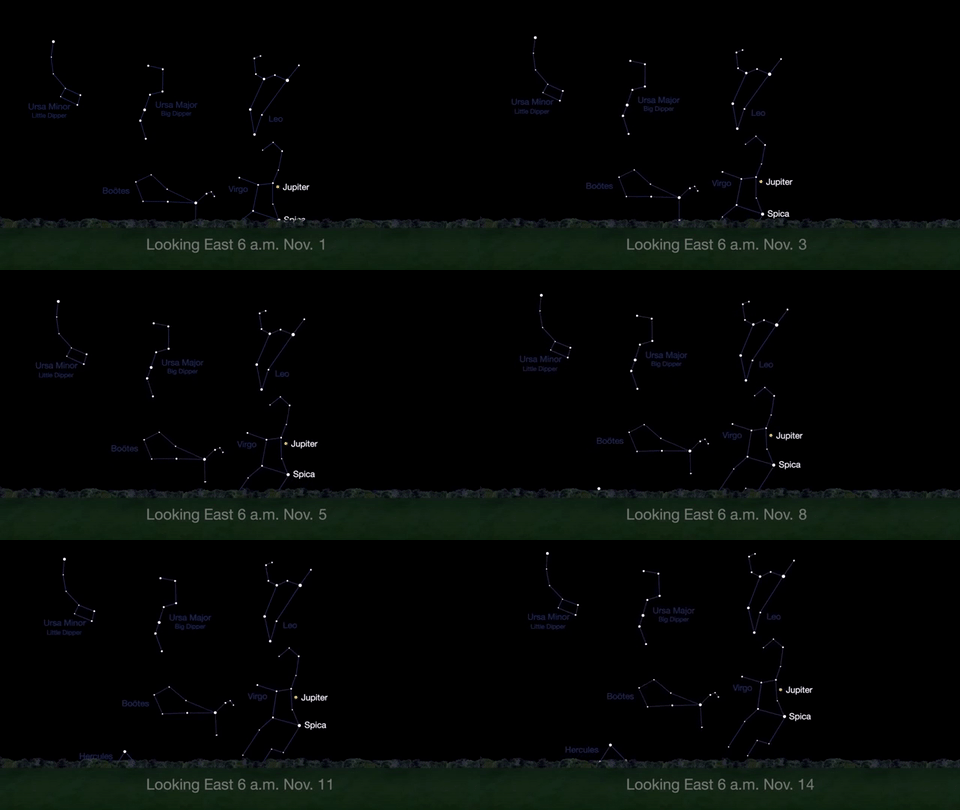
Just before dawn on November 23-24, see the waning crescent moon just above Jupiter.
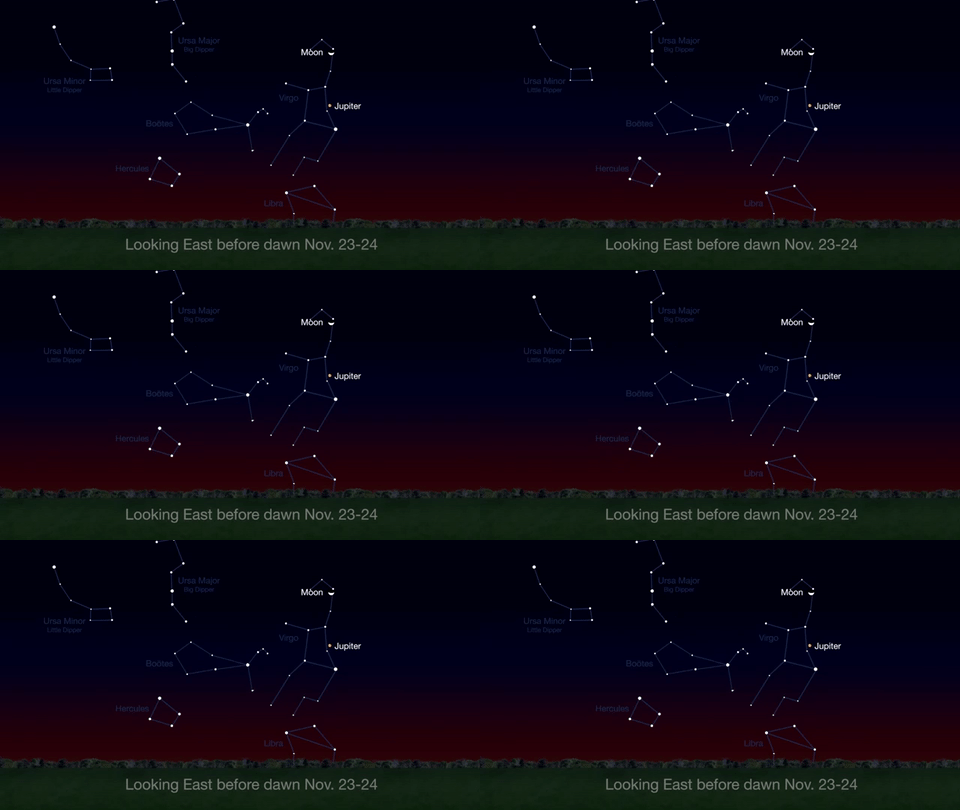
November is a great time to see the constellation Ceres as it glides past Cetus, the Whale and you will be able to see the dwarf planet move relative to the background stars, but you’ll need a telescope for this one.
This month, just like last month, there will be three meteor showers--the Northern Tuarids, the Leonids and the November Orionids.
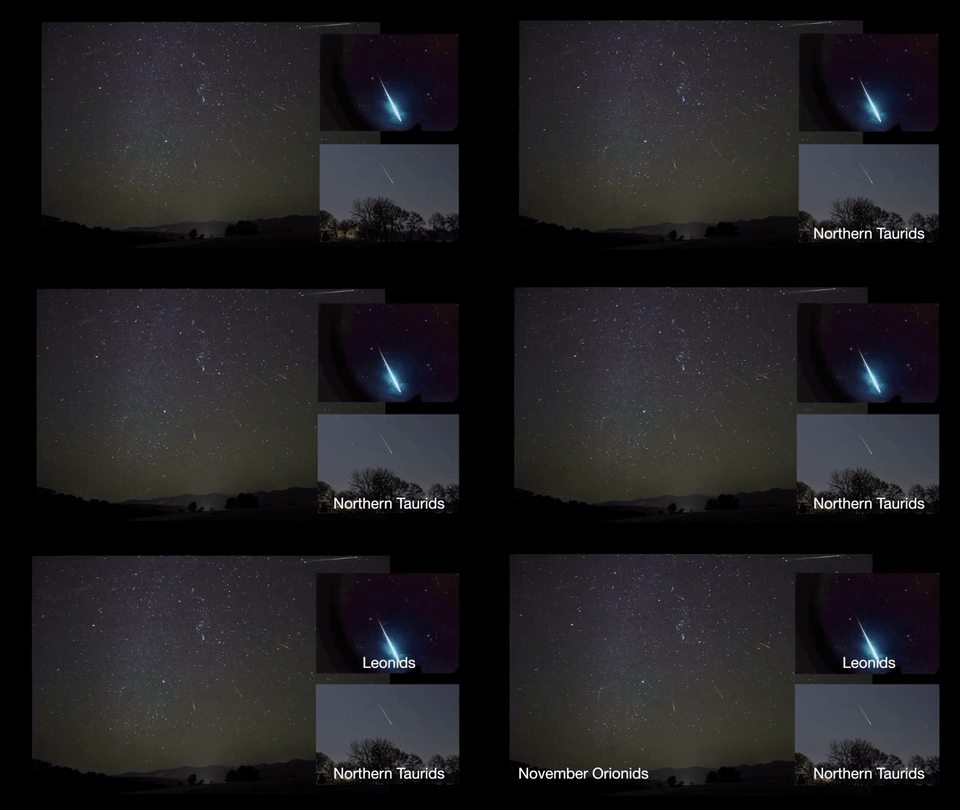
Watch the full November “What’s Up" video for more:
Make sure to follow us on Tumblr for your regular dose of space: http://nasa.tumblr.com.
Caution: Universe Work Ahead 🚧
We only have one universe. That’s usually plenty – it’s pretty big after all! But there are some things scientists can’t do with our real universe that they can do if they build new ones using computers.
The universes they create aren’t real, but they’re important tools to help us understand the cosmos. Two teams of scientists recently created a couple of these simulations to help us learn how our Nancy Grace Roman Space Telescope sets out to unveil the universe’s distant past and give us a glimpse of possible futures.
Caution: you are now entering a cosmic construction zone (no hard hat required)!

This simulated Roman deep field image, containing hundreds of thousands of galaxies, represents just 1.3 percent of the synthetic survey, which is itself just one percent of Roman's planned survey. The full simulation is available here. The galaxies are color coded – redder ones are farther away, and whiter ones are nearer. The simulation showcases Roman’s power to conduct large, deep surveys and study the universe statistically in ways that aren’t possible with current telescopes.
One Roman simulation is helping scientists plan how to study cosmic evolution by teaming up with other telescopes, like the Vera C. Rubin Observatory. It’s based on galaxy and dark matter models combined with real data from other telescopes. It envisions a big patch of the sky Roman will survey when it launches by 2027. Scientists are exploring the simulation to make observation plans so Roman will help us learn as much as possible. It’s a sneak peek at what we could figure out about how and why our universe has changed dramatically across cosmic epochs.
This video begins by showing the most distant galaxies in the simulated deep field image in red. As it zooms out, layers of nearer (yellow and white) galaxies are added to the frame. By studying different cosmic epochs, Roman will be able to trace the universe's expansion history, study how galaxies developed over time, and much more.
As part of the real future survey, Roman will study the structure and evolution of the universe, map dark matter – an invisible substance detectable only by seeing its gravitational effects on visible matter – and discern between the leading theories that attempt to explain why the expansion of the universe is speeding up. It will do it by traveling back in time…well, sort of.
Seeing into the past
Looking way out into space is kind of like using a time machine. That’s because the light emitted by distant galaxies takes longer to reach us than light from ones that are nearby. When we look at farther galaxies, we see the universe as it was when their light was emitted. That can help us see billions of years into the past. Comparing what the universe was like at different ages will help astronomers piece together the way it has transformed over time.

This animation shows the type of science that astronomers will be able to do with future Roman deep field observations. The gravity of intervening galaxy clusters and dark matter can lens the light from farther objects, warping their appearance as shown in the animation. By studying the distorted light, astronomers can study elusive dark matter, which can only be measured indirectly through its gravitational effects on visible matter. As a bonus, this lensing also makes it easier to see the most distant galaxies whose light they magnify.
The simulation demonstrates how Roman will see even farther back in time thanks to natural magnifying glasses in space. Huge clusters of galaxies are so massive that they warp the fabric of space-time, kind of like how a bowling ball creates a well when placed on a trampoline. When light from more distant galaxies passes close to a galaxy cluster, it follows the curved space-time and bends around the cluster. That lenses the light, producing brighter, distorted images of the farther galaxies.
Roman will be sensitive enough to use this phenomenon to see how even small masses, like clumps of dark matter, warp the appearance of distant galaxies. That will help narrow down the candidates for what dark matter could be made of.

In this simulated view of the deep cosmos, each dot represents a galaxy. The three small squares show Hubble's field of view, and each reveals a different region of the synthetic universe. Roman will be able to quickly survey an area as large as the whole zoomed-out image, which will give us a glimpse of the universe’s largest structures.
Constructing the cosmos over billions of years
A separate simulation shows what Roman might expect to see across more than 10 billion years of cosmic history. It’s based on a galaxy formation model that represents our current understanding of how the universe works. That means that Roman can put that model to the test when it delivers real observations, since astronomers can compare what they expected to see with what’s really out there.

In this side view of the simulated universe, each dot represents a galaxy whose size and brightness corresponds to its mass. Slices from different epochs illustrate how Roman will be able to view the universe across cosmic history. Astronomers will use such observations to piece together how cosmic evolution led to the web-like structure we see today.
This simulation also shows how Roman will help us learn how extremely large structures in the cosmos were constructed over time. For hundreds of millions of years after the universe was born, it was filled with a sea of charged particles that was almost completely uniform. Today, billions of years later, there are galaxies and galaxy clusters glowing in clumps along invisible threads of dark matter that extend hundreds of millions of light-years. Vast “cosmic voids” are found in between all the shining strands.
Astronomers have connected some of the dots between the universe’s early days and today, but it’s been difficult to see the big picture. Roman’s broad view of space will help us quickly see the universe’s web-like structure for the first time. That’s something that would take Hubble or Webb decades to do! Scientists will also use Roman to view different slices of the universe and piece together all the snapshots in time. We’re looking forward to learning how the cosmos grew and developed to its present state and finding clues about its ultimate fate.

This image, containing millions of simulated galaxies strewn across space and time, shows the areas Hubble (white) and Roman (yellow) can capture in a single snapshot. It would take Hubble about 85 years to map the entire region shown in the image at the same depth, but Roman could do it in just 63 days. Roman’s larger view and fast survey speeds will unveil the evolving universe in ways that have never been possible before.
Roman will explore the cosmos as no telescope ever has before, combining a panoramic view of the universe with a vantage point in space. Each picture it sends back will let us see areas that are at least a hundred times larger than our Hubble or James Webb space telescopes can see at one time. Astronomers will study them to learn more about how galaxies were constructed, dark matter, and much more.
The simulations are much more than just pretty pictures – they’re important stepping stones that forecast what we can expect to see with Roman. We’ve never had a view like Roman’s before, so having a preview helps make sure we can make the most of this incredible mission when it launches.
Learn more about the exciting science this mission will investigate on Twitter and Facebook.
Make sure to follow us on Tumblr for your regular dose of space!
-
 exploreasone liked this · 2 years ago
 -
 john-erby liked this · 3 years ago
 -
 2reputationpegacorns liked this · 3 years ago
 -
 mishramanish reblogged this · 4 years ago
 -
 wallsarecrumbling reblogged this · 4 years ago
 -
 bethelnie-blog liked this · 5 years ago
 -
 lucmarcou liked this · 5 years ago
 -
 insertanonymousname liked this · 5 years ago
 -
 letsboldlygomotherfuckers liked this · 5 years ago
 -
 mandylee70 liked this · 5 years ago
 -
 onlyhereforduckmemes liked this · 5 years ago
 -
 passkale reblogged this · 5 years ago
 -
 mishramanish reblogged this · 6 years ago
 -
 soap-with-bite-marks liked this · 6 years ago
 -
 joviere liked this · 6 years ago
 -
 toooceanblue reblogged this · 6 years ago
 -
 gentianablue reblogged this · 6 years ago
 -
 gentianablue liked this · 6 years ago
 -
 appleciderdoughnut reblogged this · 6 years ago
 -
 wishesarentforstars liked this · 6 years ago
 -
 csifan3 liked this · 6 years ago
 -
 creatcher liked this · 6 years ago
 -
 teaching-science reblogged this · 6 years ago
 -
 whatevenisthiscrap reblogged this · 6 years ago
 -
 whatevenisthiscrap liked this · 6 years ago
 -
 justanoldfashiontumblog liked this · 6 years ago
 -
 carmelmochi liked this · 6 years ago
 -
 owareyoualegendtoo liked this · 6 years ago
 -
 randyranks reblogged this · 6 years ago
 -
 randyranks liked this · 6 years ago
 -
 terrylhills liked this · 6 years ago
 -
 angelina-amethyst liked this · 6 years ago
 -
 the-telescope-times liked this · 6 years ago
 -
 cresc reblogged this · 6 years ago
 -
 chickendipz reblogged this · 6 years ago
 -
 galaxystew liked this · 6 years ago
 -
 vivianit4 liked this · 6 years ago
 -
 communist-rave-party liked this · 6 years ago
Explore the universe and discover our home planet with the official NASA Tumblr account
1K posts