3 … 2 … 1… ALOHA!

3 … 2 … 1… ALOHA!
Sometimes in space, you have to set your clocks to island time and gather for a good Hawaiian shirt day. In this 2001 #TBT, Expedition Two and STS-100 crew members gather for a group photo with a pre-set digital still camera.
Clockwise from the 12 o'clock point in the circle are Kent V. Rominger, Yuri V. Lonchakov, Yury V. Usachev, Umberto Guidoni, James S. Voss, Jeffrey S. Ashby, Scott E. Parazynski, John L. Phillips and Chris A. Hadfield, with Susan J. Helms at center. Usachev, Helms and Voss are members of three Expedition Two crew, with the other seven serving as the STS-100 crew on the Space Shuttle Endeavour. Usachev and Lonchakov represent Rosaviakosmos; Guidoni is associated with the European Space Agency (ESA); and Hadfield is from the Canadian Space Agency (CSA).
Make sure to follow us on Tumblr for your regular dose of space: http://nasa.tumblr.com.
More Posts from Nasa and Others
What was it like to be in a vessel as it aborted mission? How do you handle a situation like that and continue with future missions?
Solar System 10 Things: Looking Back at Pluto
In July 2015, we saw Pluto up close for the first time and—after three years of intense study—the surprises keep coming. “It’s clear,” says Jeffery Moore, New Horizons’ geology team lead, “Pluto is one of the most amazing and complex objects in our solar system.”
1. An Improving View

These are combined observations of Pluto over the course of several decades. The first frame is a digital zoom-in on Pluto as it appeared upon its discovery by Clyde Tombaugh in 1930. More frames show of Pluto as seen by the Hubble Space Telescope. The final sequence zooms in to a close-up frame of Pluto taken by our New Horizons spacecraft on July 14, 2015.
2. The Heart

Pluto’s surface sports a remarkable range of subtle colors are enhanced in this view to a rainbow of pale blues, yellows, oranges, and deep reds. Many landforms have their own distinct colors, telling a complex geological and climatological story that scientists have only just begun to decode. The image resolves details and colors on scales as small as 0.8 miles (1.3 kilometers). Zoom in on the full resolution image on a larger screen to fully appreciate the complexity of Pluto’s surface features.
3. The Smiles

July 14, 2015: New Horizons team members Cristina Dalle Ore, Alissa Earle and Rick Binzel react to seeing the spacecraft's last and sharpest image of Pluto before closest approach.
4. Majestic Mountains

Just 15 minutes after its closest approach to Pluto, the New Horizons spacecraft captured this near-sunset view of the rugged, icy mountains and flat ice plains extending to Pluto's horizon. The backlighting highlights more than a dozen layers of haze in Pluto's tenuous atmosphere. The image was taken from a distance of 11,000 miles (18,000 kilometers) to Pluto; the scene is 780 miles (1,250 kilometers) wide.
5. Icy Dunes

Found near the mountains that encircle Pluto’s Sputnik Planitia plain, newly discovered ridges appear to have formed out of particles of methane ice as small as grains of sand, arranged into dunes by wind from the nearby mountains.
6. Glacial Plains

The vast nitrogen ice plains of Pluto’s Sputnik Planitia – the western half of Pluto’s “heart”—continue to give up secrets. Scientists processed images of Sputnik Planitia to bring out intricate, never-before-seen patterns in the surface textures of these glacial plains.
7. Colorful and Violent Charon

High resolution images of Pluto’s largest moon, Charon, show a surprisingly complex and violent history. Scientists expected Charon to be a monotonous, crater-battered world; instead, they found a landscape covered with mountains, canyons, landslides, surface-color variations and more.
8. Ice Volcanoes

One of two potential cryovolcanoes spotted on the surface of Pluto by the New Horizons spacecraft. This feature, known as Wright Mons, was informally named by the New Horizons team in honor of the Wright brothers. At about 90 miles (150 kilometers) across and 2.5 miles (4 kilometers) high, this feature is enormous. If it is in fact an ice volcano, as suspected, it would be the largest such feature discovered in the outer solar system.
9. Blue Rays

Pluto's receding crescent as seen by New Horizons at a distance of 120,000 miles (200,000 kilometers). Scientists believe the spectacular blue haze is a photochemical smog resulting from the action of sunlight on methane and other molecules in Pluto's atmosphere. These hydrocarbons accumulate into small haze particles, which scatter blue sunlight—the same process that can make haze appear bluish on Earth.
10. Encore

On Jan. 1, 2019, New Horizons will fly past a small Kuiper Belt Object named MU69 (nicknamed Ultima Thule)—a billion miles (1.5 billion kilometers) beyond Pluto and more than four billion miles (6.5 billion kilometers) from Earth. It will be the most distant encounter of an object in history—so far—and the second time New Horizons has revealed never-before-seen landscapes.
Make sure to follow us on Tumblr for your regular dose of space: http://nasa.tumblr.com.
Save the Date: 2024 Total Solar Eclipse
On April 8, 2024, a total solar eclipse will travel through Mexico, cross the United States from Texas to Maine, and exit North America along Canada’s Atlantic coast. A total solar eclipse occurs when the Moon passes between the Sun and the Earth, completely blocking the face of the Sun. The sky will darken as if it were dawn or dusk.
Weather permitting, people throughout most of North and Central America, including all of the contiguous United States, will be able to view at least a partial solar eclipse. A partial solar eclipse is when the Moon only covers part of the Sun. People in Hawaii and parts of Alaska will also experience a partial solar eclipse. Click here to learn more about when and where the solar eclipse will be visible: go.nasa.gov/Eclipse2024Map
Not in the path of the eclipse? Join us online to watch the eclipse with NASA. Set a reminder to watch live: https://go.nasa.gov/3V2CQML
Make sure to follow us on Tumblr for your regular dose of space!
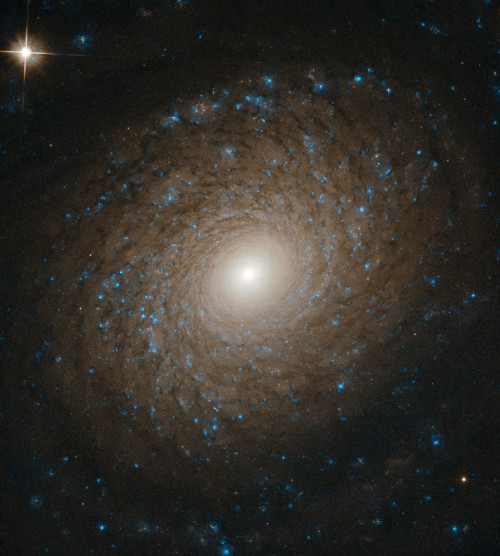
Flawless. Gorgeous. Stellar.
You probably think this post is about you. Well, it could be.
In this image taken by our Hubble Space Telescope, we see a spiral galaxy with arms that widen as they whirl outward from its bright core, slowly fading into the emptiness of space. Click here to learn more about this beautiful galaxy that resides 70 million light-years away.
Credit: ESA/Hubble & NASA, L. Ho Make sure to follow us on Tumblr for your regular dose of space: http://nasa.tumblr.com.
Observing the Ozone Hole from Space: A Science Success Story
Using our unique ability to view Earth from space, we are working together with NOAA to monitor an emerging success story – the shrinking ozone hole over Antarctica.

Thirty years ago, the nations of the world agreed to the landmark ‘Montreal Protocol on Substances that Deplete the Ozone Layer.’ The Protocol limited the release of ozone-depleting chlorofluorocarbons (CFCs) into the atmosphere.

Since the 1960s our scientists have worked with NOAA researchers to study the ozone layer.

We use a combination of satellite, aircraft and balloon measurements of the atmosphere.

The ozone layer acts like a sunscreen for Earth, blocking harmful ultraviolet, or UV, rays emitted by the Sun.

In 1985, scientists first reported a hole forming in the ozone layer over Antarctica. It formed over Antarctica because the Earth’s atmospheric circulation traps air over Antarctica. This air contains chlorine released from the CFCs and thus it rapidly depletes the ozone.

Because colder temperatures speed up the process of CFCs breaking up and releasing chlorine more quickly, the ozone hole fluctuates with temperature. The hole shrinks during the warmer summer months and grows larger during the southern winter. In September 2006, the ozone hole reached a record large extent.

But things have been improving in the 30 years since the Montreal Protocol. Thanks to the agreement, the concentration of CFCs in the atmosphere has been decreasing, and the ozone hole maximum has been smaller since 2006’s record.

That being said, the ozone hole still exists and fluctuates depending on temperature because CFCs have very long lifetimes. So, they still exist in our atmosphere and continue to deplete the ozone layer.
To get a view of what the ozone hole would have looked like if the world had not come to the agreement to limit CFCs, our scientists developed computer models. These show that by 2065, much of Earth would have had almost no ozone layer at all.

Luckily, the Montreal Protocol exists, and we’ve managed to save our protective ozone layer. Looking into the future, our scientists project that by 2065, the ozone hole will have returned to the same size it was thirty years ago.
Make sure to follow us on Tumblr for your regular dose of space: http://nasa.tumblr.com
What are Gravitational Waves?
Today, the National Science Foundation (NSF) announced the detection of gravitational waves by the Laser Interferometer Gravitational-Wave Observatory (LIGO), a pair of ground-based observatories. But...what are gravitational waves? Let us explain:

Gravitational waves are disturbances in space-time, the very fabric of the universe, that travel at the speed of light. The waves are emitted by any mass that is changing speed or direction. The simplest example is a binary system, where a pair of stars or compact objects (like black holes) orbit their common center of mass.

We can think of gravitational effects as curvatures in space-time. Earth’s gravity is constant and produces a static curve in space-time. A gravitational wave is a curvature that moves through space-time much like a water wave moves across the surface of a lake. It is generated only when masses are speeding up, slowing down or changing direction.
Did you know Earth also gives off gravitational waves? Earth orbits the sun, which means its direction is always changing, so it does generate gravitational waves, although extremely weak and faint.
What do we learn from these waves?
Observing gravitational waves would be a huge step forward in our understanding of the evolution of the universe, and how large-scale structures, like galaxies and galaxy clusters, are formed.
Gravitational waves can travel across the universe without being impeded by intervening dust and gas. These waves could also provide information about massive objects, such as black holes, that do not themselves emit light and would be undetectable with traditional telescopes.

Just as we need both ground-based and space-based optical telescopes, we need both kinds of gravitational wave observatories to study different wavelengths. Each type complements the other.
Ground-based: For optical telescopes, Earth’s atmosphere prevents some wavelengths from reaching the ground and distorts the light that does.
Space-based: Telescopes in space have a clear, steady view. That said, telescopes on the ground can be much larger than anything ever launched into space, so they can capture more light from faint objects.
How does this relate to Einstein’s theory of relativity?
The direct detection of gravitational waves is the last major prediction of Einstein’s theory to be proven. Direct detection of these waves will allow scientists to test specific predictions of the theory under conditions that have not been observed to date, such as in very strong gravitational fields.
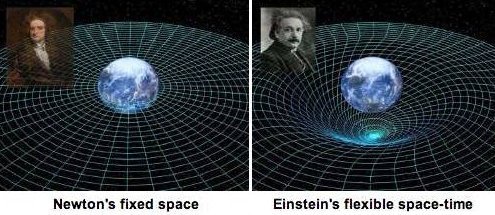
In everyday language, “theory” means something different than it does to scientists. For scientists, the word refers to a system of ideas that explains observations and experimental results through independent general principles. Isaac Newton's theory of gravity has limitations we can measure by, say, long-term observations of the motion of the planet Mercury. Einstein's relativity theory explains these and other measurements. We recognize that Newton's theory is incomplete when we make sufficiently sensitive measurements. This is likely also true for relativity, and gravitational waves may help us understand where it becomes incomplete.
Make sure to follow us on Tumblr for your regular dose of space: http://nasa.tumblr.com
2019 Temperature By the Numbers
The Year
2nd Hottest
2019 was the second-hottest year since modern record keeping began. NASA and the National Oceanic and Atmospheric Administration work together to track temperatures around the world and study how they change from year to year. For decades, the overall global temperature has been increasing.

Over the long term, world temperatures are warming, but each individual year is affected by things like El Niño ocean patterns and specific weather events.
The global temperature is an average, so not every place on Earth had its second-warmest year. For instance, the continental U.S. had a cold October, but Alaska set records for high temperatures. The U.S. was still warmer than average over the year.
Globally, Earth’s temperature in 2019 was more than 2°F warmer than the late 19th Century.
The Record
140 years
Since 1880, we can put together a consistent record of temperatures around the planet and see that it was much colder in the late-19th century. Before 1880, uncertainties in tracking global temperatures are larger. Temperatures have increased even faster since the 1970s, the result of increasing greenhouse gases in the atmosphere.

10 years
The last decade was the hottest decade on record.

20,000 Individual Observations
Scientists from NASA use data from more than 20,000 weather stations and Antarctic research stations, together with ship- and buoy-based observations of sea surface temperatures to track global temperatures.

The Consequences
90%
As Earth warms, polar ice is melting at an accelerated rate. The Arctic is warming even faster than the rest of the planet. This northern summer, 90% of the surface of the Greenland Ice Sheet melted.

8 inches
Melting ice raises sea levels around the world. While ice melts into the ocean, heat also causes the water to expand. Since 1880, sea levels globally have risen approximately 8 inches, although regional rates of sea level rise can be even higher.

100+ fires
As temperatures increase, fire seasons burn hotter and longer. During June and July 2019, more than 100 long-lived and intense wildfires burned north of the Arctic circle. This year also saw intense, record-setting fires in Australia.


46% increase in CO2 levels
This decades-long warming trend is the result of increasing greenhouse gases in the atmosphere, released by human activities.

Make sure to follow us on Tumblr for your regular dose of space: http://nasa.tumblr.com
A Tour of Storms Across the Solar System

Earth is a dynamic and stormy planet with everything from brief, rumbling thunderstorms to enormous, raging hurricanes, which are some of the most powerful and destructive storms on our world. But other planets also have storm clouds, lightning — even rain, of sorts. Let’s take a tour of some of the unusual storms in our solar system and beyond.
Tune in May 22 at 3 p.m. for more solar system forecasting with NASA Chief Scientist Jim Green during the latest installment of NASA Science Live: https://www.nasa.gov/nasasciencelive.

1. At Mercury: A Chance of Morning Micrometeoroid Showers and Magnetic ‘Tornadoes’
Mercury, the planet nearest the Sun, is scorching hot, with daytime temperatures of more than 800 degrees Fahrenheit (about 450 degrees Celsius). It also has weak gravity — only about 38% of Earth's — making it hard for Mercury to hold on to an atmosphere.
Its barely there atmosphere means Mercury doesn’t have dramatic storms, but it does have a strange "weather" pattern of sorts: it’s blasted with micrometeoroids, or tiny dust particles, usually in the morning. It also has magnetic “tornadoes” — twisted bundles of magnetic fields that connect the planet’s magnetic field to space.

2. At Venus: Earth’s ‘Almost’ Twin is a Hot Mess
Venus is often called Earth's twin because the two planets are similar in size and structure. But Venus is the hottest planet in our solar system, roasting at more than 800 degrees Fahrenheit (430 degrees Celsius) under a suffocating blanket of sulfuric acid clouds and a crushing atmosphere. Add to that the fact that Venus has lightning, maybe even more than Earth.
In visible light, Venus appears bright yellowish-white because of its clouds. Earlier this year, Japanese researchers found a giant streak-like structure in the clouds based on observations by the Akatsuki spacecraft orbiting Venus.

3. At Earth: Multiple Storm Hazards Likely
Earth has lots of storms, including thunderstorms, blizzards and tornadoes. Tornadoes can pack winds over 300 miles per hour (480 kilometers per hour) and can cause intense localized damage.
But no storms match hurricanes in size and scale of devastation. Hurricanes, also called typhoons or cyclones, can last for days and have strong winds extending outward for 675 miles (1,100 kilometers). They can annihilate coastal areas and cause damage far inland.

4. At Mars: Hazy with a Chance of Dust Storms
Mars is infamous for intense dust storms, including some that grow to encircle the planet. In 2018, a global dust storm blanketed NASA's record-setting Opportunity rover, ending the mission after 15 years on the surface.
Mars has a thin atmosphere of mostly carbon dioxide. To the human eye, the sky would appear hazy and reddish or butterscotch colored because of all the dust suspended in the air.

5. At Jupiter: A Shrinking Icon
It’s one of the best-known storms in the solar system: Jupiter’s Great Red Spot. It’s raged for at least 300 years and was once big enough to swallow Earth with room to spare. But it’s been shrinking for a century and a half. Nobody knows for sure, but it's possible the Great Red Spot could eventually disappear.

6. At Saturn: A Storm Chasers Paradise
Saturn has one of the most extraordinary atmospheric features in the solar system: a hexagon-shaped cloud pattern at its north pole. The hexagon is a six-sided jet stream with 200-mile-per-hour winds (about 322 kilometers per hour). Each side is a bit wider than Earth and multiple Earths could fit inside. In the middle of the hexagon is what looks like a cosmic belly button, but it’s actually a huge vortex that looks like a hurricane.
Storm chasers would have a field day on Saturn. Part of the southern hemisphere was dubbed "Storm Alley" by scientists on NASA's Cassini mission because of the frequent storm activity the spacecraft observed there.

7. At Titan: Methane Rain and Dust Storms
Earth isn’t the only world in our solar system with bodies of liquid on its surface. Saturn’s moon Titan has rivers, lakes and large seas. It’s the only other world with a cycle of liquids like Earth’s water cycle, with rain falling from clouds, flowing across the surface, filling lakes and seas and evaporating back into the sky. But on Titan, the rain, rivers and seas are made of methane instead of water.
Data from the Cassini spacecraft also revealed what appear to be giant dust storms in Titan’s equatorial regions, making Titan the third solar system body, in addition to Earth and Mars, where dust storms have been observed.

8. At Uranus: A Polar Storm
Scientists were trying to solve a puzzle about clouds on the ice giant planet: What were they made of? When Voyager 2 flew by in 1986, it spotted few clouds. (This was due in part to the thick haze that envelops the planet, as well as Voyager's cameras not being designed to peer through the haze in infrared light.) But in 2018, NASA’s Hubble Space Telescope snapped an image showing a vast, bright, stormy cloud cap across the north pole of Uranus.

9. At Neptune: Methane Clouds
Neptune is our solar system's windiest world. Winds whip clouds of frozen methane across the ice giant planet at speeds of more than 1,200 miles per hour (2,000 kilometers per hour) — about nine times faster than winds on Earth.
Neptune also has huge storm systems. In 1989, NASA’s Voyager 2 spotted two giant storms on Neptune as the spacecraft zipped by the planet. Scientists named the storms “The Great Dark Spot” and “Dark Spot 2.”

10. It’s Not Just Us: Extreme Weather in Another Solar System
Scientists using NASA’s Hubble Space Telescope made a global map of the glow from a turbulent planet outside our solar system. The observations show the exoplanet, called WASP-43b, is a world of extremes. It has winds that howl at the speed of sound, from a 3,000-degree-Fahrenheit (1,600-degree-Celsius) day side, to a pitch-black night side where temperatures plunge below 1,000 degrees Fahrenheit (500 degrees Celsius).
Discovered in 2011, WASP-43b is located 260 light-years away. The planet is too distant to be photographed, but astronomers detected it by observing dips in the light of its parent star as the planet passes in front of it.
Make sure to follow us on Tumblr for your regular dose of space: http://nasa.tumblr.com.
NASA’s Satellite Data Help Save Lives
For the first time, measurements from our Earth-observing satellites are being used to help combat a potential outbreak of life-threatening cholera. Humanitarian teams in Yemen are targeting areas identified by a NASA-supported project that precisely forecasts high-risk regions based on environmental conditions observed from space.

Cholera is caused by consuming food or water contaminated with a bacterium called Vibrio cholerae.

The disease affects millions of people every year and can be deadly. It remains a major threat to global health, especially in developing countries, such as Yemen, where access to clean water is limited.

To calculate the likelihood of an outbreak, scientists run a computer model that takes satellite observations of things like rain and temperatures and combines them with information on local sanitation and clean water infrastructure. In 2017, the model achieved 92 percent accuracy in predicting the regions where cholera was most likely to occur and spread in Yemen. An outbreak that year in Yemen was the world's worst, with more than 1.1 million suspected cases and more than 2,300 deaths, according to the World Health Organization.

International humanitarian organizations took notice. In January 2018, Fergus McBean, a humanitarian adviser with the U.K.'s Department for International Development, read about the NASA-funded team's 2017 results and contacted them with an ambitious challenge: to create and implement a cholera forecasting system for Yemen, in only four months.
“It was a race against the start of rainy season,” McBean said.
The U.S. researchers began working with U.K. Aid, the U.K. Met Office, and UNICEF on the innovative approach to use the model to inform cholera risk reduction in Yemen.
In March, one month ahead of the rainy season, the U.K. international development office began using the model’s forecasts. Early results show the science team’s model predictions, coupled with Met Office weather forecasts, are helping UNICEF and other aid groups target their response to where support is needed most.

Photo Credit: UNICEF
“By joining up international expertise with those working on the ground, we have for the very first time used these sophisticated predictions to help save lives and prevent needless suffering,” said Charlotte Watts, chief scientist for United Kingdom’s Department for International Development.
Read more: go.nasa.gov/2MxKyw4
Make sure to follow us on Tumblr for your regular dose of space: http://nasa.tumblr.com.
The United Launch Alliance’s Atlas V rocket carrying the Orbital ATK Cygnus module rolls to Cape Canaveral Air Force Station's Launch Pad 41 in this time-lapse video. The rollout is in preparation for the Orbital ATK CRS-7 mission to deliver supplies to the International Space Station.
Launch is currently scheduled for 11:11 a.m. EDT, watch live coverage: http://www.nasa.gov/live
Make sure to follow us on Tumblr for your regular dose of space: http://nasa.tumblr.com
-
 gallifreyandistress liked this · 3 years ago
 -
 justatheatrekidwholovesspace liked this · 4 years ago
 -
 aaaaaaaaaaaavm liked this · 4 years ago
 -
 ironside451 reblogged this · 4 years ago
 -
ironside451 liked this · 4 years ago
-
 gaetanopezzella liked this · 4 years ago
 -
 ooooooooooooooops liked this · 4 years ago
 -
 junohnebula liked this · 4 years ago
 -
 briefbearjudgegoth liked this · 5 years ago
 -
 sayulitashirtcompany reblogged this · 5 years ago
 -
 majalasota liked this · 5 years ago
 -
 shandira liked this · 5 years ago
 -
 casualwonderlandtale liked this · 5 years ago
 -
 that-demon-named-dustin liked this · 5 years ago
 -
 good-gay-vibes-blog liked this · 5 years ago
 -
 automaticdestinytrash reblogged this · 5 years ago
 -
 mshilling1821 reblogged this · 5 years ago
 -
mshilling1821 liked this · 5 years ago
-
 changeursmile-20192811 liked this · 5 years ago
 -
 mrrigel liked this · 5 years ago
 -
 snickerzer liked this · 5 years ago
 -
 aphthranduil liked this · 5 years ago
 -
 babyhoba liked this · 5 years ago
 -
 urlocalmilf liked this · 5 years ago
 -
 mtn53 liked this · 5 years ago
 -
 struwburry liked this · 5 years ago
 -
 kiruskak-blog liked this · 5 years ago
 -
 rot-gospel liked this · 5 years ago
 -
 laviadelmale reblogged this · 5 years ago
Explore the universe and discover our home planet with the official NASA Tumblr account
1K posts