What’s Up For April 2017
What’s Up for April 2017
Jupiter, the king of the planets, is visible all night long, and the Lyrids meteor shower peaks on April 22.

On April 7, Jupiter--the king of planets--reaches opposition, when it shines brightest and appears largest.

Jupiter will be almost directly overhead at midnight.

This is also a great time to observe the planet’s Galilean moons--Io, Ganymeade, Europa and Callisto. They can be easily seen through binoculars.

With binoculars, you can even see the Great Red Spot as the storm transits the planet every ten hours.

Looking east on April 22, look to the skies for the Summer Triangle, consisting of Deneb, in Cygnus, the Swan; Altair in Aquila, the Eagle; and Vega, in Lyre(the Harp).

Get ready for the Lyrids, the year’s second major meteor shower, as it pierces the Summer Triangle in the early morning hours of April 22. Since the shower begins close to the new moon, expect excellent almost moonless viewing conditions.

You can catch up on solar system and all of our missions at www.nasa.gov
Watch the full “What’s Up for April 2017″ video:
Make sure to follow us on Tumblr for your regular dose of space: http://nasa.tumblr.com
More Posts from Nasa and Others
Small Tissue Chips in Space a Big Leap Forward for Research
Tissue chips, thumb-drive sized devices that contain human cells in a 3D matrix, represent a giant leap in science.
They can test cells’ response to:
•stresses
•drugs
•genetic changes

The Tissue Chips in Space initiative seeks to better understand the role of microgravity on human health and disease and to translate that understanding to improved human health on Earth.
This series of investigations to test tissue chips in microgravity aboard the International Space Station is planned through a collaboration between the National Center for Advancing Translational Sciences (NCATS) at the National Institutes for Health (NIH) and the National Laboratory in partnership with NASA.

Many of the changes in the human body caused by microgravity resemble the onset and progression of diseases associated with aging on Earth, but in space, changes occur much faster. Scientists may be able to use tissue chips in space to model changes that take months or years to happen on Earth.
A tissue chip needs three properties, according to Lucie Low, scientific program manager at NCATS. “It has to be 3D,” she explained. “It must have multiple different types of cells, and it must have microfluidic channels. Essentially, you get a functional unit of what human tissues are like, outside of the body,” said Low.

As accurate models of the structure and function of human organs, tissue chips provide a model for predicting whether a drug, vaccine or biologic agent is safe in humans more quickly and effectively than current methods.

This first phase of Tissue Chips in Space includes five investigations. An investigation of immune system aging is planned for launch on the SpaceX CRS-16 flight, scheduled for mid-November. The other four, scheduled to launch on subsequent flights, include lung host defense, the blood-brain barrier, musculoskeletal disease and kidney function. This phase tests the effects of microgravity on the tissue chips and demonstrates the capability of the automated system.
All five investigations make a second flight about 18 months later to confirm use of the model, such as testing potential drugs on the particular organs. Four more projects are scheduled for launch in summer 2020, including two on engineered heart tissue to understand cardiovascular health, one on muscle wasting and another on gut inflammation.
Ultimately, the technology could allow astronauts going into space to take along personalized chips that could be used to monitor changes in their bodies and to test possible countermeasures and therapies. That would be a major leap forward in keeping astronauts healthy on missions to deep space!
Make sure to follow us on Tumblr for your regular dose of space: http://nasa.tumblr.com
What are we doing at the Winter Olympics?
This Winter Olympics, our researchers are hoping for what a lot of Olympic athletes want in PyeongChang: precipitation and perfection.
Our researchers are measuring the quantity and type of snow falling on the slopes, tracks and halfpipes at the 2018 PyeongChang Winter Olympics and Paralympic games.

We are using ground instruments, satellite data and weather models to deliver detailed reports of current snow conditions and are testing experimental forecast models at 16 different points near Olympic event venues (shown below). The information is relayed every six hours to Olympic officials to help them account for approaching weather.

We are performing this research in collaboration with the Korea Meteorological Administration, as one of 20 agencies from about a dozen countries and the World Meteorological Organization’s World Weather Research Programme in a project called the International Collaborative Experiments for PyeongChang 2018 Olympic and Paralympic Winter Games, or ICE-POP. The international team will make measurements from the start of the Olympics on Feb. 9 through the end of the Paralympics on March 18.

Image Credit: Republic of Korea
South Korea's diverse terrain makes this project an exciting, albeit challenging, endeavor for scientists to study snow events. Ground instruments provide accurate snow observations in easily accessible surfaces, but not on uneven and in hard to reach mountainous terrain. A satellite in space has the ideal vantage point, but space measurements are difficult because snow varies in size, shape and water content. Those variables mean the snowflakes won't fall at the same speed, making it hard to estimate the rates of snowfall. Snowflakes also have angles and planar "surfaces" that make it difficult for satellite radars to read.

The solution is to gather data from space and the ground and compare the measurements. We will track snowstorms and precipitation rates from space using the Global Precipitation Measurement mission, or GPM. The GPM Core Observatory is a joint mission between NASA and the Japan Aerospace Exploration Agency and coordinates with twelve other U.S. and international satellites to provide global maps of precipitation every 30 minutes (shown below).

We will complement the space data with 11 of our instruments observing weather from the ground in PyeongChang. These instruments are contributing to a larger international pool of measurements taken by instruments from the other ICE-POP participants: a total of 70 instruments deployed at the Olympics. We deployed the Dual-frequency, Dual-polarized, Doppler Radar system, usually housed at our Wallops Flight Facility in Virginia, to PyeongChang (shown below) that measures the quantity and types of falling snow.

The data will help inform Olympic officials about the current weather conditions, and will also be incorporated into the second leg of our research: improving weather forecast models. Our Marshall Space Flight Center's Short-term Prediction Research and Transition Center (SPoRT) is teaming up with our Goddard Space Flight Center to use an advanced weather prediction model to provide weather forecasts in six-hour intervals over specific points on the Olympic grounds.

The above animation is our Unified Weather Research Forecast model (NU-WRF) based at Goddard. The model output shows a snow event on Jan. 14, 2018 in South Korea. The left animation labeled "precipitation type" shows where rain, snow, ice, and freezing rain are predicted to occur at each forecast time. The right labeled "surface visibility" is a measure of the distance that people can see ahead of them.
The SPoRT team will be providing four forecasts per day to the Korea Meteorological Administration, who will look at this model in conjunction with all the real-time forecast models in the ICE-POP campaign before relaying information to Olympic officials. The NU-WRF is one of five real-time forecast models running in the ICE-POP campaign.
For more information, watch the video below or read the entire story HERE.
Make sure to follow us on Tumblr for your regular dose of space: http://nasa.tumblr.com.
September 2017 Was 🔥 on the Sun
The Sun started September 2017 with flair, emitting 31 sizable solar flares and releasing several powerful coronal mass ejections, or CMEs, between Sept. 6-10.

Solar flares are powerful bursts of radiation. Harmful radiation from a flare cannot pass through Earth’s atmosphere to physically affect humans on the ground, however — when intense enough — they can disturb the atmosphere in the layer where GPS and communications signals travel.

CMEs are massive clouds of solar material and magnetic fields that erupt from the Sun at incredible speeds. Depending on the direction they’re traveling in, CMEs can spark powerful geomagnetic storms in Earth’s magnetic field.
As always, we and our partners had many missions observing the Sun from both Earth and space, enabling scientists to study these events from multiple perspectives. With this integrated picture of solar activity, scientists can better track the evolution of solar eruptions and work toward improving our understanding of space weather.

The National Oceanic and Atmospheric Administration (NOAA)’s Geostationary Operational Environmental Satellite-16, or GOES-16, watches the Sun’s upper atmosphere — called the corona — at six different wavelengths, allowing it to observe a wide range of solar phenomena. GOES-16 caught this footage of an X9.3 flare on Sept. 6, 2017.
This was the most intense flare recorded during the current 11-year solar cycle. X-class denotes the most intense flares, while the number provides more information about its strength. An X2 is twice as intense as an X1, an X3 is three times as intense, and so on. GOES also detected solar energetic particles associated with this activity.

Our Solar Dynamics Observatory captured these images of X2.2 and X9.3 flares on Sept. 6, 2017, in a wavelength of extreme ultraviolet light that shows solar material heated to over one million degrees Fahrenheit.

JAXA/NASA’s Hinode caught this video of an X8.2 flare on Sept. 10, 2017, the second largest flare of this solar cycle, with its X-ray Telescope. The instrument captures X-ray images of the corona to help scientists link changes in the Sun’s magnetic field to explosive solar events like this flare.

Key instruments aboard our Solar and Terrestrial Relations Observatory, or STEREO, include a pair of coronagraphs — instruments that use a metal disk called an occulting disk to study the corona. The occulting disk blocks the Sun’s bright light, making it possible to discern the detailed features of the Sun’s outer atmosphere and track coronal mass ejections as they erupt from the Sun.
On Sept. 9, 2017, STEREO watched a CME erupt from the Sun. The next day, STEREO observed an even bigger CME. The Sept. 10 CME traveled away from the Sun at calculated speeds as high as 7 million mph, and was one of the fastest CMEs ever recorded. The CME was not Earth-directed: It side-swiped Earth’s magnetic field, and therefore did not cause significant geomagnetic activity. Mercury is in view as the bright white dot moving leftwards in the frame.

Like STEREO, ESA/NASA’s Solar and Heliospheric Observatory, or SOHO, uses a coronagraph to track solar storms. SOHO also observed the CMEs that occurred during Sept. 9-10, 2017; multiple views provide more information for space weather models. As the CME expands beyond SOHO’s field of view, a flurry of what looks like snow floods the frame. These are high-energy particles flung out ahead of the CME at near-light speeds that struck SOHO’s imager.

Our Interface Region Imaging Spectrometer, or IRIS, captured this video on Sept. 10, 2017, showing jets of solar material swimming down toward the Sun’s surface. These structures are sometimes observed in the corona during solar flares, and this particular set was associated with the X8.2 flare of the same day.

Our Solar Radiation and Climate Experiment, or SORCE, collected the above data on total solar irradiance, the total amount of the Sun’s radiant energy, throughout Sept. 2017. While the Sun produced high levels of extreme ultraviolet light, SORCE actually detected a dip in total irradiance during the month’s intense solar activity.
A possible explanation for this observation is that over the active regions — where solar flares originate — the darkening effect of sunspots is greater than the brightening effect of the flare’s extreme ultraviolet emissions. As a result, the total solar irradiance suddenly dropped during the flare events.
Scientists gather long-term solar irradiance data in order to understand not only our dynamic star, but also its relationship to Earth’s environment and climate. We are ready to launch the Total Spectral solar Irradiance Sensor-1, or TSIS-1, this December to continue making total solar irradiance measurements.

The intense solar activity also sparked global aurora on Mars more than 25 times brighter than any previously seen by NASA’s Mars Atmosphere and Volatile Evolution, or MAVEN, mission. MAVEN studies the Martian atmosphere’s interaction with the solar wind, the constant flow of charged particles from the Sun. These images from MAVEN’s Imaging Ultraviolet Spectrograph show the appearance of bright aurora on Mars during the September solar storm. The purple-white colors show the intensity of ultraviolet light on Mars’ night side before (left) and during (right) the event.
For all the latest on solar and space weather research, follow us on Twitter @NASASun or Facebook.
GOES images are courtesy of NOAA. Hinode images are courtesy of JAXA and NASA. SOHO images are courtesy of ESA and NASA.
Make sure to follow us on Tumblr for your regular dose of space: http://nasa.tumblr.com.
Do you listen to music in space? If so, what are you jamming to?
SpaceX Dragon: What’s Onboard?
SpaceX is scheduled to launch its Dragon spacecraft into orbit on April 8, which will be the company’s eighth mission under our Commercial Resupply Services contract. This flight will deliver science and supplies to the International Space Station.

The experiments headed to the orbiting laboratory will help us test the use of an expandable space habitat in microgravity, assess the impact of antibodies on muscle wasting in a microgravity environment, use microgravity to seek insight into the interactions of particle flows at the nanoscale level and use protein crystal growth in microgravity to help in the design of new drugs to fight disease. Here’s an in-depth look at each of them:
The Bigelow Expandable Activity Module (BEAM)

Space is in limited supply on the International Space Station, but with BEAM, the amount of crew space could be expanded! BEAM is an experimental expandable capsule that attaches to the space station. After installation, it will expand to roughly 13-feet long and 10.5 feet in diameter, which would provide a large volume where a crew member could enter. During the two-year test mission, astronauts will enter the module for a few hours three-to-four times a year to retrieve sensor data and conduct assessments of the module’s condition.
Why? Expandable habitats greatly decrease the amount of transport volume at launch for future space missions. They not only take up less room on a rocket, but also provide greatly enhanced space for living and working once they are set up.
The Rodent Research-3-Eli Lilly

The Rodent Research-3-Eli Lilly investigation will use mice as a model for human health to study whether certain drugs might prevent muscle or bone loss while in microgravity.
Why? Crew members experience significant decreases in their bone density and muscle mass during spaceflight if they do not get enough exercise during long-duration missions. The results could expand scientist’s understanding of muscle atrophy and bone loss in space, by testing an antibody that has been known to prevent muscle wasting in mice on Earth.
Microbial Observatory-1
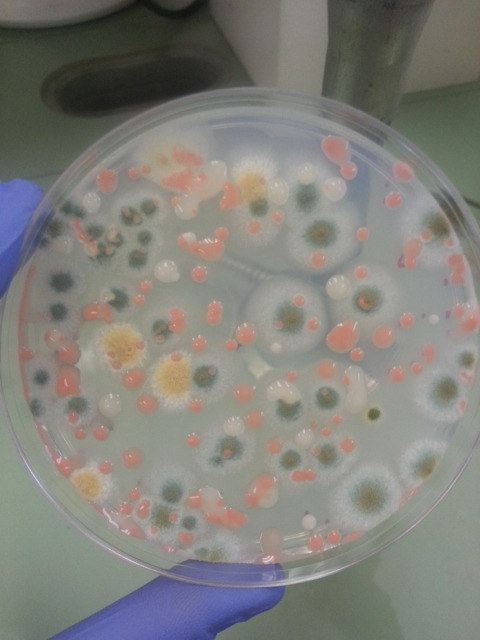
The Microbial Observatory-1 experiment will track and monitor changes to microbial flora over time on the space station.
Why? Obtaining data on these microbial flora could help us understand how such microbes could affect crew health during future long-duration missions.
Micro-10

The Micro-10 investigation will study how the stress of microgravity triggers changes in growth, gene expression, physical responses and metabolism of a fungus called Aspergillus nidulans.
Why? This experiment will study fungi in space for the purpose of potentially developing new medicine for use both in space and on Earth. The stressfull environment of space causes changes to all forms of life, from bacteria and fungi, to animals and people.
Genes in Space-1

Genes in Space-1 is a student-designed experiment that will test whether the polymerase chain reaction (PCR) — which is a fast and relatively inexpensive technique that can amplify or “photocopy” small segments of DNA — could be used to study DNA alterations that crew experience during spaceflight.
Why? In space, the human immune system’s function is altered. Findings from this experiment could help combat some of the DNA changes that crew onboard space station experience while on orbit.
Microchannel Diffusion

Nano science and nanotechnology are the study and application of exceptionally small things and can be used across the fields of medicine, biology, computer science and many others. The way fluid moves is very different on this small scale, so scientists want to know how microparticles might interact. The Microchannel Diffusion investigation simulates these interactions by studying them at a larger scale, the microscopic level. This is only possible on the orbiting laboratory, where Earth’s gravity is not strong enough to interact with the molecules in a sample, so they behave more like they would at the nanoscale.
Why? Nanofluidic sensors could measure the air in the space station, or used to deliver drugs to specific places in the body, among other potential uses. Knowledge learned from this investigation may have implications for drug delivery, particle filtration and future technological applications for space exploration.
The CASIS Protein Crystal Growth 4 (CASIS PCG 4)

CASIS PCG 4 is made up of two investigations that both leverage the microgravity environment in the growth of protein crystals and focus on structure-based drug design (SBDD). Growing crystals in microgravity avoids some of the obstacles they face on Earth, such as sedimentation.
Why? SBDD is an integral component in the drug discovery and development process. It relies on three-dimensional, structural information provided by the protein crystallography to inform the design of more potent, effective and selective drugs.
Watch the Launch!

The Dragon capsule will launch on a Falcon 9 rocket from Cape Canaveral Air Force Station in Florida.
Launch coverage begins at 3:15 p.m. EDT, with launch scheduled for 4:43 p.m. Watch live online on NASA Television: nasa.gov/nasatv
Make sure to follow us on Tumblr for your regular dose of space: http://nasa.tumblr.com
Earth’s Land Ice by the Numbers
“At a glacial pace” used to mean moving so slowly the movement is almost imperceptible. Lately though, glaciers are moving faster. Ice on land is melting and flowing, sending water to the oceans, where it raises sea levels.

In 2018, we launched the Ice, Cloud and Land Elevation Satellite-2 (ICESat-2) to continue a global record of ice elevation. Now, the results are in. Using millions of measurements from a laser in space and quite a bit of math, researchers have confirmed that Earth is rapidly losing ice.
16 Years

ICESat-2 was a follow-up mission to the original ICESat, which launched in 2003 and took measurements until 2009. Comparing the two records tells us how much ice sheets have lost over 16 years.

½ Inch
During those 16 years, melting ice from Antarctica and Greenland was responsible for just over a half-inch of sea level rise. When ice on land melts, it eventually finds its way to the ocean. The rapid melt at the poles is no exception.

400,000 Olympic Swimming Pools
One gigaton of ice holds enough water to fill 400,000 Olympic swimming pools. It’s also enough ice to cover Central Park in New York in more than 1,000 feet of ice.

200 Gigatons
Between 2003 and 2019, Greenland lost 200 gigatons of ice per year. That’s 80 million Olympic swimming pools reaching the ocean every year, just from Greenland alone.

118 Gigatons
During the same time period, Antarctica lost 118 gigatons of ice per year. That’s another 47 million Olympic swimming pools every year. While there has been some elevation gain in the continent’s center from increased snowfall, it’s nowhere near enough to make up for how much ice is lost to the sea from coastal glaciers.

10,000 Pulses
ICESat-2 sends out 10,000 pulses of laser light a second down to Earth’s surface and times how long it takes them to return to the satellite, down to a billionth of a second. That’s how we get such precise measurements of height and changing elevation.

These numbers confirm what scientists have been finding in most previous studies and continue a long record of data showing how Earth’s polar ice is melting. ICESat-2 is a key tool in our toolbox to track how our planet is changing.
Make sure to follow us on Tumblr for your regular dose of space: http://nasa.tumblr.com.

During a recent close flyby of the gas giant Jupiter, our Juno spacecraft captured this stunning series of images showing swirling cloud patterns on the planet’s south pole. At first glance, the series might appear to be the same image repeated. But closer inspection reveals slight changes, which are most easily noticed by comparing the far-left image with the far-right image.
Directly, the images show Jupiter. But, through slight variations in the images, they indirectly capture the motion of the Juno spacecraft itself, once again swinging around a giant planet hundreds of millions of miles from Earth.
Juno captured this color-enhanced time-lapse sequence of images on Feb. 7 between 10:21 a.m. and 11:01 a.m. EST. At the time, the spacecraft was between 85,292 to 124,856 miles (137,264 to 200,937 kilometers) from the tops of the clouds of the planet with the images centered on latitudes from 84.1 to 75.5 degrees south.
Credit: NASA/JPL-Caltech/SwRI/MSSS/Gerald Eichstädt
Make sure to follow us on Tumblr for your regular dose of space: http://nasa.tumblr.com.
What’s Up November 2017
What’s Up For November?
Dawn pairing of Jupiter and Venus, Moon shines near star clusters, meteor activity all month long!

This month binoculars will come in handy--to view the moon, star clusters, and a close pairing of Venus and Jupiter.

You can’t miss bright Venus in the predawn sky. This month Venus pairs up with Jupiter on the morning of November 13th.

The Leonids peak on a moonless November 17th. Expect no more than 10 meteors an hour around 3:00 a.m., the height of the shower.

The Northern and Southern sub-branches of the Taurid meteor shower offer sparse counts of about 5 meteors per hour, but slow, bright meteors are common.

The nearby November Orionids peak on the 28th. In contrast to the Taurids, the Orionids are swift. But don’t expect more than 3 meteors per hour.

The moon glides by three beautiful star clusters in the morning sky this month, and a pair of binoculars will allow you to see the individual stars in the clusters. Aim your binoculars at the Pleiades and the moon on the 5th.

Then aim at the Messier or M-35 cluster and the moon on the 7th and the Beehive cluster and the moon on the 10th.

Meanwhile, at dusk, catch Saturn as it dips closer to the western horizon and pairs up with Mercury on the 24th through the 28th.

Also, Comet C/2017 O1 should still be a binocular-friendly magnitude 7 or 8 greenish object in November. Use Polaris, the North Star as a guide. Look in the East to Northeast sky in the late evening.
Watch the full What’s Up for November Video:
Make sure to follow us on Tumblr for your regular dose of space: http://nasa.tumblr.com.

Andre Douglas
A Virginia native, Andre Douglas served in the U.S. Coast Guard as a naval architect and salvage engineer. Douglas later worked as an engineer for Johns Hopkins University Applied Physics Laboratory on NASA's DART mission to redirect an asteroid. https://go.nasa.gov/48FBlam
Make sure to follow us on Tumblr for your regular dose of space!
Hello!! Its wonderful to be able to ask questions, thank you!
About Perseverance, does it have a self-repair option? And as Curiosity is still operational, will they run missions together? Or will they split up to cover more distance?
Is this a sign that we're close to being able to set foot on Mars?
My final question is how do you receive the messages from such a long distance?
Thanks for all your hard work! 加油/Good luck!
“Is this a sign that we are close to being able to set foot on Mars?”
-
 filmmovement liked this · 2 years ago
 -
 127yslkg liked this · 4 years ago
 -
 pondaoftan reblogged this · 5 years ago
 -
 theproblemswiththesky liked this · 6 years ago
 -
 gingashienna liked this · 7 years ago
 -
 trappedwithinwonderland liked this · 7 years ago
 -
 littlegfelicity-blog liked this · 7 years ago
 -
cassialara reblogged this · 7 years ago
-
cassialara liked this · 7 years ago
-
 forbidden-art liked this · 7 years ago
 -
dwiwejdis liked this · 7 years ago
-
 mitsukiibuki liked this · 7 years ago
 -
 badsquid liked this · 7 years ago
 -
 fishbaby reblogged this · 7 years ago
 -
awesomesteph1297-blog liked this · 8 years ago
-
 stove-burns-on-my-hand liked this · 8 years ago
 -
 missmack1500 liked this · 8 years ago
 -
 suffixpride liked this · 8 years ago
 -
superfastjellyfishh reblogged this · 8 years ago
-
superfastjellyfishh liked this · 8 years ago
-
 lucassodrawings-blog liked this · 8 years ago
Explore the universe and discover our home planet with the official NASA Tumblr account
1K posts