10 Ground-breaking Earth Satellite Images From 2018
10 Ground-breaking Earth Satellite Images from 2018
In 2018, our satellites captured beautiful imagery from throughout the solar system and beyond. However, some of our favorite visualizations are of this very planet. While this list is by no means exhaustive, it does capture some Earth satellite images from this year that are both visually striking as well as scientifically informative. This list also represents a broad variety of Earth’s features, as well as satellite instrumentation. Take a journey with our eyes in the sky!
10. Hurricane Florence

Before making landfall, Hurricane Florence churned in the Atlantic for a full two weeks — making it among the longest-lived cyclones of the 2018 season. When it finally did hit land on Sep. 14, the storm devastated the southeastern U.S. coast with intense winds, torrential rains and severe flooding.
This natural-color image was acquired by MODIS on the Terra Satellite on Sep. 12, 2018.
Images like this, as well as other satellite information, were used to anticipate the impact of the storm. Our Disasters Program created flood proxy maps that were shared with the Federal Emergency Management Agency (FEMA) and the National Guard to estimate how many and which communities would be most affected by the storm, in order to help prepare recovery efforts ahead of time.
9. Australia’s Lake Eyre Basin

The Lake Eyre Basin covers one-sixth of Australia and is one of the world’s largest internally draining river systems. However, the rivers supported by this system are ephemeral, meaning that they only run for short periods of time following unpredictable rain — the rest of the time, the Basin is a dry, arid desert.
However, when the heavy rain comes, the basin erupts in an explosion of green. In this false-color image captured by the Operational Land Imager (OLI) on Landsat 8 on Apr. 25, 2018, you can see how the vegetation completely envelops the spaces where the water has receded. (Flood water is indicated by light blue, and vegetation is indicated by light green.)
Satellites are an excellent tool for tracking greening events that are followed by flooding. These events offer opportunities for predictive tools as well as recreation.
8. Alaska’s Chukchi Sea

A Monet painting comes to life as the Chukchi Sea swirls with microscopic marine algae.
This image was captured off the Alaskan coast by OLI on Landsat 8 on Jun. 18, 2018. After the Arctic sea ice breaks up each spring, the nutrient-rich Bering Sea water mixes with the nutrient-poor Alaskan coastal water. Each type of water brings with it a different type of phytoplankton and the surface waters have just enough light for the algae to populate and flourish. The result is these mesmerizing patterns of turquoise and green.
This image represents one piece of much larger, incredibly complex ecosystem. While one would not normally associate the breaking up of sea ice with phytoplankton blooms, it is an intricate process of the phytoplankton life cycle. The size of the blooms have varied greatly from year to year, and experts are unsure why. Images like these can help scientists track the development of these blooms and link it to other environmental changes.
7. Hawaii’s Kilauea

Sometimes fresh lava is best viewed in infrared.
This false-color image of Kilauea, captured by OLI on Landsat 8 on May 23, 2018, shows the infrared signal emitted by lava flowing toward the sea. The purple areas surrounding the glowing lava are clouds lit from below, indicating that this image was taken through a break in the clouds.
The Puʻu ʻŌʻō Kupaianaha eruption has been continuously spewing red-hot lava since 1983, making it the longest eruption at Kilauea in recorded history. However, new fissures opened up this year that forced many to evacuate the area. Hawaii’s largest lake evaporated in hours and hundreds of homes were destroyed in Vacationland and Kapoho.
Imagery, seismometers and ground-based instruments were used to track the underground movement of magma. Infrared imagery can be incredibly helpful in disasters like this when you to view data that cannot be observed with the naked eye.
6. California’s Woolsey Burn Scar

Nothing quite encapsulates the destruction of a wildfire like a photo from outer space.
This image of the Woolsey Fire aftermath in Southern California was captured on Nov. 18, 2018 by the Advanced Spaceborned Thermal Emission and Reflection Radiometer (ASTER) on the Terra satellite. This false-color infrared image has been enhanced to clearly show the burned vegetation (indicated by brown) and the vegetation that survived unscathed (indicated by green).
The Woolsey Fire clearly left its mark, with almost 152 square miles (394 square km) and 88% of the Santa Monica Mountains National Recreation Area badly burned. Images like this one can assist fire managers in the area plan for recovery.
5. Bangladesh’s Padma River

As the years go by, the Padma River grows and shrinks, twists and turns. It never has a fixed shape, and as a result, thousands of people must regularly adapt to the constant changes in the river’s 75-mile (130-km) shoreline.
This image captured on Jan. 20, 2018 by OLI on Landsat 8 depicts one of the major rivers of Bangladesh. For thirty years, scientists have been tracking the erosion of the river with satellite imagery. Combinations of shortwave infrared, near infrared, and visible light are used to detect differences year-to-year in width, depth, and shape of the river. Sometimes the river splits off, but then rejoins again later. These patterns are created by the river carrying and depositing sediment, shaping the curves of the path of water.
Monitoring the Padma River is going to become especially important as a new bridge development project advances in the Char Janajat area. Although the bridge will most certainly help shorten travel times for citizens, nobody is quite sure how the river erosion might affect the construction and vice versa.
4. Alaska’s Yakutat Glacier

It’s hard to believe that Harlequin Lake was once all dry land — but it only started to form once Yakutat Glacier started melting. The lake appeared at the beginning of the twentieth century, and has been growing rapidly ever since.
In this hauntingly beautiful image, captured on Sep. 21 2018 by OLI on Landsat 8, the effect of climate change is apparent — especially when compared to earlier images of the region.
Unless the climate warming starts to reverse very soon — which scientists consider very unlikely — Yakutat could be gone as soon as 2070.
3. South Africa’s Theewaterskloof

Cape Town is a seaside city planted on the tip of South Africa. It’s a city known for its beaches and biodiversity — it also almost became known as the first major city to officially run out of water.
This image of Cape Town’s largest reservoir — Theewaterskloof — was acquired on Jul. 9th, 2018 by OLI on Landsat 8. By the time this photo was taken, the city’s main reservoirs stood at 55%. This was a huge increase from where it stood just six months earlier: just 13%.
The severe water shortage in the region started in 2015, only to become more threatening after three successive and unusually dry years. The entire city was preparing for Day Zero — the day the tap water would be shut off.
Despite forecasts that Day Zero would arrive in April, a combination of heavier rains and local conservation efforts restored the majority of the reservoir.
2. Aerosol Earth

Aerosols are all around us. From the smoke from a fire, to the dust in the wind to the salt in sea spray — these solid particles and liquid droplets are always swirling in our atmosphere, oftentimes unseen.
The Goddard Earth Observing System Forward Processing (GEOS FP) model uses mathematical equations to model what is happening in our atmosphere. The inputs for its equations — temperature, moisture, wind, etc. — come from our satellites and ground sensors.
This visualization was compiled on Aug. 24, 2018 — obviously a busy day for aerosols in our atmosphere. Swirls of sea salt (indicated by blue) reveal typhoons Soulik and Cimaron heading straight towards South Korea and Japan. A haze of black carbon (indicated by red) suffuse from agricultural burning in Africa and large wildfires in North America. And clouds of dust (indicated by purple) float off the Sahara desert.
1. Camp Fire

With nearly a hundred fatalities, hundreds of thousands of acres burned and billions of dollars of damage, the world watched in horror as Camp Fire grew to become the most destructive California wildfire in recorded history.
This image was captured on Nov. 8, 2018 by OLI on Landsat 8 on the same day Camp Fire ignited. It consolidates both visible light and shortwave-infrared light in order to highlight the active fire. Strong winds and dry conditions literally fanned the flames and spread this wildfire like a rash.
This image has not only become the iconic portrait for Camp Fire, it is also sobering representation of how quickly a fire can grow out of control in a short amount of time. Even from space, you can almost smell the massive plumes of smoke and feel the heat of the fires.
Whether you realize it or not, our Earth satellite missions are collecting data everyday in order to monitor environmental changes and prepare for natural disasters. If your interest is piqued by this list, head over to the Earth Observatory. The Earth Observatory updates daily with fresh, new content — brought to you by none other than our eyes in the sky.
Make sure to follow us on Tumblr for your regular dose of space: http://nasa.tumblr.com
More Posts from Nasa and Others
From Apollo to Commercial Crew: Get To Know Historic Launch Pad 39A
Originally built for the massive Saturn V rockets that sent astronauts on Apollo missions to the Moon, Launch Complex 39A also served as one of the two launch pads used by the space shuttle. Between Apollo, Skylab, Apollo-Soyuz and the space shuttle, this launch pad has been the starting point for many of the nation’s most challenging and inspiring missions.

In 2014, SpaceX signed a property agreement with NASA for use and operation of the launch complex for 20 years, and the company modified the facility to prepare for the processing and launch of its Falcon 9 and Falcon Heavy rockets.

The SpaceX Falcon 9 rocket carrying the company’s Crew Dragon on its Demo-2 flight test to the International Space Station with NASA astronauts Robert Behnken and Douglas Hurley will lift off from the same historic site where astronauts first launched to the moon. Launch Complex 39A at NASA’s Kennedy Space Center in Florida is also the site of dozens of space shuttle launches that helped build the orbital laboratory.
Launch Complexes 39A and B were constructed in the 1960s. Both launch pads have a long history of supporting launches for the Apollo and Space Shuttle Programs. Launch Pad 39A was the launch site for 11 Saturn V Apollo missions, including Apollo 11, the first Moon landing. The pad also was the launch site for 82 space shuttle missions, including STS-1, the first shuttle launch, the STS-125 final servicing mission for the Hubble Space Telescope, and STS-135, the final shuttle mission.

After the space shuttle was retired in 2011, we began the process to transform Kennedy Space Center from a historically government-only launch facility into a multi-user spaceport for both government and commercial use. On April 14, 2014, the agency signed a property agreement with SpaceX for use of the launch site for the next 20 years.

SpaceX upgraded and modified the launch pad to support its Falcon 9 and Falcon Heavy rockets. The company also built a horizontal processing hangar at the base of the pad to perform final vehicle integration prior to flight. The first SpaceX launch from the pad was the company’s 10th commercial resupply services (CRS-10) mission for us. A SpaceX Falcon 9 launched a Dragon cargo spacecraft on CRS-10 on Feb. 19, 2017. The Dragon delivered about 5,500 pounds of supplies to the space station, including the Stratospheric Aerosol and Gas Experiment (SAGE) III instrument to further study ozone in the Earth’s atmosphere. Combined with SpaceX, we’ve launched more than 100 missions from Pad 39A.

Because of our partnership with SpaceX within our agency’s Commercial Crew Program, Launch Complex 39A will once again be the site of crewed missions to the space station.
🚀 TUNE IN starting at 12:15 p.m. EDT on Wednesday, May 27 as NASA and SpaceX launch astronauts Robert Behnken and Douglas Hurley to the International Space Station aboard the Crew Dragon spacecraft: www.nasa.gov.live.
Make sure to follow us on Tumblr for your regular dose of space: http://nasa.tumblr.com
Pinpointing the Cause of Earth’s Recent Record CO2 Spike
A new NASA study provides space-based evidence that Earth’s tropical regions were the cause of the largest annual increases in atmospheric carbon dioxide concentration seen in at least 2,000 years.
What was the cause of this?
Scientists suspect that the 2015-2016 El Niño – one of the largest on record – was responsible. El Niño is a cyclical warming pattern of ocean circulation in the Pacific Ocean that affects weather all over the world. Before OCO-2, we didn’t have enough data to understand exactly how El Nino played a part.

Analyzing the first 28 months of data from our Orbiting Carbon Observatory (OCO-2) satellite, researchers conclude that impacts of El Niño-related heat and drought occurring in the tropical regions of South America, Africa and Indonesia were responsible for the record spike in global carbon dioxide.

These three tropical regions released 2.5 gigatons more carbon into the atmosphere than they did in 2011. This extra carbon dioxide explains the difference in atmospheric carbon dioxide growth rates between 2011 and the peak years of 2015-16.

In 2015 and 2016, OCO-2 recorded atmospheric carbon dioxide increases that were 50% larger than the average increase seen in recent years preceding these observations.

In eastern and southern tropical South America, including the Amazon rainforest, severe drought spurred by El Niño made 2015 the driest year in the past 30 years. Temperatures were also higher than normal. These drier and hotter conditions stressed vegetation and reduced photosynthesis, meaning trees and plants absorbed less carbon from the atmosphere. The effect was to increase the net amount of carbon released into the atmosphere.

In contrast, rainfall in tropical Africa was at normal levels, but ecosystems endured hotter-than-normal temperatures. Dead trees and plants decomposed more, resulting in more carbon being released into the atmosphere.

Meanwhile, tropical Asia had the second-driest year in the past 30 years. Its increased carbon release, primarily from Indonesia, was mainly due to increased peat and forest fires - also measured by satellites.

We knew El Niños were one factor in these variations, but until now we didn’t understand, at the scale of these regions, what the most important processes were. OCO-2’s geographic coverage and data density are allowing us to study each region separately.
Why does the amount of carbon dioxide in our atmosphere matter?
The concentration of carbon dioxide in Earth’s atmosphere is constantly changing. It changes from season to season as plants grow and die, with higher concentrations in the winter and lower amounts in the summer. Annually averaged atmospheric carbon dioxide concentrations have generally increased year over year since the 1800s – the start of the widespread Industrial Revolution. Before then, Earth’s atmosphere naturally contained about 595 gigatons of carbon in the form of carbon dioxide. Currently, that number is 850 gigatons.

Carbon dioxide is a greenhouse gas, which means that it can trap heat. Since greenhouse gas is the principal human-produced driver of climate change, better understanding how it moves through the Earth system at regional scales and how it changes over time are important aspects to monitor.

Get more information about these data HERE.
Make sure to follow us on Tumblr for your regular dose of space: http://nasa.tumblr.com.
What are we doing at the Winter Olympics?
This Winter Olympics, our researchers are hoping for what a lot of Olympic athletes want in PyeongChang: precipitation and perfection.
Our researchers are measuring the quantity and type of snow falling on the slopes, tracks and halfpipes at the 2018 PyeongChang Winter Olympics and Paralympic games.

We are using ground instruments, satellite data and weather models to deliver detailed reports of current snow conditions and are testing experimental forecast models at 16 different points near Olympic event venues (shown below). The information is relayed every six hours to Olympic officials to help them account for approaching weather.

We are performing this research in collaboration with the Korea Meteorological Administration, as one of 20 agencies from about a dozen countries and the World Meteorological Organization’s World Weather Research Programme in a project called the International Collaborative Experiments for PyeongChang 2018 Olympic and Paralympic Winter Games, or ICE-POP. The international team will make measurements from the start of the Olympics on Feb. 9 through the end of the Paralympics on March 18.

Image Credit: Republic of Korea
South Korea's diverse terrain makes this project an exciting, albeit challenging, endeavor for scientists to study snow events. Ground instruments provide accurate snow observations in easily accessible surfaces, but not on uneven and in hard to reach mountainous terrain. A satellite in space has the ideal vantage point, but space measurements are difficult because snow varies in size, shape and water content. Those variables mean the snowflakes won't fall at the same speed, making it hard to estimate the rates of snowfall. Snowflakes also have angles and planar "surfaces" that make it difficult for satellite radars to read.

The solution is to gather data from space and the ground and compare the measurements. We will track snowstorms and precipitation rates from space using the Global Precipitation Measurement mission, or GPM. The GPM Core Observatory is a joint mission between NASA and the Japan Aerospace Exploration Agency and coordinates with twelve other U.S. and international satellites to provide global maps of precipitation every 30 minutes (shown below).

We will complement the space data with 11 of our instruments observing weather from the ground in PyeongChang. These instruments are contributing to a larger international pool of measurements taken by instruments from the other ICE-POP participants: a total of 70 instruments deployed at the Olympics. We deployed the Dual-frequency, Dual-polarized, Doppler Radar system, usually housed at our Wallops Flight Facility in Virginia, to PyeongChang (shown below) that measures the quantity and types of falling snow.

The data will help inform Olympic officials about the current weather conditions, and will also be incorporated into the second leg of our research: improving weather forecast models. Our Marshall Space Flight Center's Short-term Prediction Research and Transition Center (SPoRT) is teaming up with our Goddard Space Flight Center to use an advanced weather prediction model to provide weather forecasts in six-hour intervals over specific points on the Olympic grounds.

The above animation is our Unified Weather Research Forecast model (NU-WRF) based at Goddard. The model output shows a snow event on Jan. 14, 2018 in South Korea. The left animation labeled "precipitation type" shows where rain, snow, ice, and freezing rain are predicted to occur at each forecast time. The right labeled "surface visibility" is a measure of the distance that people can see ahead of them.
The SPoRT team will be providing four forecasts per day to the Korea Meteorological Administration, who will look at this model in conjunction with all the real-time forecast models in the ICE-POP campaign before relaying information to Olympic officials. The NU-WRF is one of five real-time forecast models running in the ICE-POP campaign.
For more information, watch the video below or read the entire story HERE.
Make sure to follow us on Tumblr for your regular dose of space: http://nasa.tumblr.com.
10 Things to Know About Explorer 1, America's First Satellite
Sixty years ago, the hopes of Cold War America soared into the night sky as a rocket lofted skyward above Cape Canaveral, a soon-to-be-famous barrier island off the Florida coast.
1. The Original Science Robot

Sixty years ago this week, the United States sent its first satellite into space on Jan. 31, 1958. The spacecraft, small enough to be held triumphantly overhead, orbited Earth from as far as 1,594 miles (2,565 km) above and made the first scientific discovery in space. It was called, appropriately, Explorer 1.
2. Why It's Important

The world had changed three months before Explorer 1's launch, when the Soviet Union lofted Sputnik into orbit on Oct. 4, 1957. That satellite was followed a month later by a second Sputnik spacecraft. All of the missions were inspired when an international council of scientists called for satellites to be placed in Earth orbit in the pursuit of science. The Space Age was on.
3. It...Wasn't Easy

When Explorer 1 launched, we (NASA) didn't yet exist. It was a project of the U.S. Army and was built by Caltech's Jet Propulsion Laboratory (JPL) in Pasadena, California. After the Sputnik launch, the Army, Navy and Air Force were tasked by President Eisenhower with getting a satellite into orbit within 90 days. The Navy's Vanguard Rocket, the first choice, exploded on the launch pad Dec. 6, 1957.
4. The People Behind Explorer 1

University of Iowa physicist James Van Allen, whose proposal was chosen for the Vanguard satellite, had made sure his scientific instrument—a cosmic ray detector—would fit either launch vehicle. Wernher von Braun, working with the Army Ballistic Missile Agency in Alabama, directed the design of the Redstone Jupiter-C launch rocket, while JPL Director William Pickering oversaw the design of Explorer 1 and other upper stages of the rocket. JPL was also responsible for sending and receiving communications from the spacecraft.
5. All About the Science

Explorer 1's science payload took up 37.25 inches (95 cm) of the satellite's total 80.75 inches (2.05 meters). The main instruments were a cosmic-ray detector; internal, external and nose-cone temperature sensors; a micrometeorite impact microphone; a ring of micrometeorite erosion gauges; and two transmitters. There were two antennas in the body of the satellite and its four flexible whips formed a turnstile antenna that extended with the rotation of the satellite. Electrical power was provided by batteries that made up 40 percent of the total payload weight.
6. At the Center of a Space Doughnut

The first scientific discovery in space came from Explorer 1. Earth is surrounded by radiation belts of electrons and charged particles, some of them moving at nearly the speed of light, about 186,000 miles (299,000 km) per second. The two belts are shaped like giant doughnuts with Earth at the center. Data from Explorer 1 and Explorer 3 (launched March 26, 1958) led to the discovery of the inner radiation belt, while Pioneer 3 (Dec. 6, 1958) and Explorer IV (July 26, 1958) provided additional data, leading to the discovery of the outer radiation belt. The radiation belts can be hazardous for spacecraft, but they also protect the planet from harmful particles and energy from the Sun.
7. 58,376 Orbits

Explorer 1's last transmission was received May 21, 1958. The spacecraft re-entered Earth's atmosphere and burned up on March 31, 1970, after 58,376 orbits. From 1958 on, more than 100 spacecraft would fall under the Explorer designation.
8. Find Out More!

Want to know more about Explorer 1? Check out the website and download the poster celebrating 60 years of space science. go.nasa.gov/Explorer1
9. Hold the Spacecraft In Your Hands

Create your own iconic Explorer 1 photo (or re-create the original), with our Spacecraft 3D app. Follow @NASAEarth this week to see how we #ExploreAsOne. https://go.nasa.gov/2BmSCWi
10. What's Next?

All of our missions can trace a lineage to Explorer 1. This year alone, we're going to expand the study of our home planet from space with the launch of two new satellite missions (GRACE-FO and ICESat-2); we're going back to Mars with InSight; and the Transiting Exoplanet Survey Satellite (TESS) will search for planets outside our solar system by monitoring 200,000 bright, nearby stars. Meanwhile, the Parker Solar Probe will build on the work of James Van Allen when it flies closer to the Sun than any mission before.
Make sure to follow us on Tumblr for your regular dose of space: http://nasa.tumblr.com.
@manishkumarmishra: How does all this work benefit us back here on Earth?
Solar System: Things to Know this Week
On May 22 Mars will be at opposition. That's when Mars, Earth and the sun all line up, with Earth directly in the middle. A few days later, Mars and Earth will reach the points in their orbits around the sun where they are nearest to each other. The closer Mars comes to Earth in its orbit, the larger and brighter it appears in the sky.

It's an opportunity for backyard skywatchers—and a good time to catch up on all the exploration now underway at the Red Planet. Here are a few things to know this week about Mars:
1. Red Star Rising

The best time to see Mars at its brightest is when it's highest in the sky, which is around midnight during May. Look toward the south in the constellation Scorpius (where right now you can also catch the planet Saturn). If you have a telescope, you may be able to pick out some of the features on its surface. But don't fall for Internet rumors claiming that Mars will appear as big as the full moon. Instead, it will look like a bright, reddish or orange star. Get Mars viewing tips HERE.
2. Roving Weather Reporter

Our Mars Curiosity mission has now been roving across the floor of Gale Crater for two full Martian years—that's four Earth years. This robotic geologist is a meteorologist, too, and its long journey has allowed it to observe the local weather for two full seasonal cycles. During that time, the rover's instruments have recorded temperatures ranging from 60.5 degrees Fahrenheit (15.9 degrees Celsius) on a summer afternoon, to minus 148 F (minus 100 C) on a winter night. They also detected an intriguing spike in methane gas—but it hasn't happened since.
3. Increasing Clouds, with a Chance of Dust Storms

The Mars Reconnaissance Orbiter keeps an eye on Martian weather, too, but on a global scale. Every week, you can see the latest weather report, including an animation showing storms and clouds across the face of Mars.
4. Walking the Ancient Shoreline

Mars explorers have studied evidence for years that the early history of the planet included times where liquid water flowed and pooled freely. But just how deep those ancient lakes were, and how long they lasted, remains a topic of debate. A new study offers a more detailed picture of the rise and fall of standing bodies of water.
5. Wish Upon a Star

It's true that Mars will be especially bright in the sky this week. But did you ever consider that Earth often shines for Mars as well? This image from the Curiosity rover shows our whole world as a single point of light. When people finally do stand on Mars, they'll be able to look at the twilight sky—and see home. Left: the Earth and the Moon in the evening sky of Mars, as seen by the Curiosity rover. Right: Mars rising over Salt Lake City. Mars credit: NASA/JPL-Caltech/MSSS/TAMU. Earth credit: Bill Dunford.
Want to learn more? Read our full list of the 10 things to know this week about the solar system HERE.
Make sure to follow us on Tumblr for your regular dose of space: http://nasa.tumblr.com
Ten Observations From Our Flying Telescope

SOFIA is a Boeing 747SP aircraft with a 100-inch telescope used to study the solar system and beyond by observing infrared light that can’t reach Earth’s surface.

What is infrared light? It’s light we cannot see with our eyes that is just beyond the red portion of visible light we see in a rainbow. It can be used to change your TV channels, which is how remote controls work, and it can tell us how hot things are.

Everything emits infrared radiation, even really cold objects like ice and newly forming stars! We use infrared light to study the life cycle of stars, the area around black holes, and to analyze the chemical fingerprints of complex molecules in space and in the atmospheres of other planets – including Pluto and Mars.

Above, is the highest-resolution image of the ring of dust and clouds around the back hole at the center of our Milky Way Galaxy. The bright Y-shaped feature is believed to be material falling from the ring into the black hole – which is located where the arms of the Y intersect.

The magnetic field in the galaxy M82 (pictured above) aligns with the dramatic flow of material driven by a burst of star formation. This is helping us learn how star formation shapes magnetic fields of an entire galaxy.

A nearby planetary system around the star Epsilon Eridani, the location of the fictional Babylon 5 space station, is similar to our own: it’s the closest known planetary system around a star like our sun and it also has an asteroid belt adjacent to the orbit of its largest, Jupiter-sized planet.

Observations of a supernova that exploded 10,000 years ago, that revealed it contains enough dust to make 7,000 Earth-sized planets!

Measurements of Pluto’s upper atmosphere, made just two weeks before our New Horizons spacecraft’s Pluto flyby. Combining these observations with those from the spacecraft are helping us understand the dwarf planet’s atmosphere.

A gluttonous star that has eaten the equivalent of 18 Jupiters in the last 80 years, which may change the theory of how stars and planets form.

Molecules like those in your burnt breakfast toast may offer clues to the building blocks of life. Scientists hypothesize that the growth of complex organic molecules like these is one of the steps leading to the emergence of life.

This map of carbon molecules in Orion’s Horsehead nebula (overlaid on an image of the nebula from the Palomar Sky Survey) is helping us understand how the earliest generations of stars formed. Our instruments on SOFIA use 14 detectors simultaneously, letting us make this map faster than ever before!
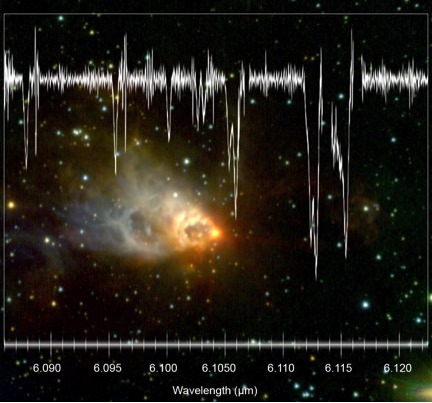
Pinpointing the location of water vapor in a newly forming star with groundbreaking precision. This is expanding our understanding of the distribution of water in the universe and its eventual incorporation into planets. The water vapor data from SOFIA is shown above laid over an image from the Gemini Observatory.

We captured the chemical fingerprints that revealed celestial clouds collapsing to form young stars like our sun. It’s very rare to directly observe this collapse in motion because it happens so quickly. One of the places where the collapse was observed is shown in this image from The Two Micron All Sky Survey.
Learn more by following SOFIA on Facebook, Twitter and Instagram.
Make sure to follow us on Tumblr for your regular dose of space: http://nasa.tumblr.com
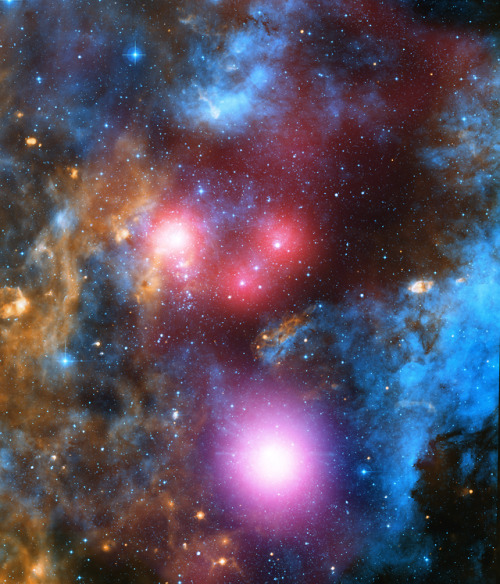
That star stuff you see here? That's what you're made of. You possess the elements ✨
This composite image from our Chandra X-ray Observatory, the Spitzer Space Telescope and the Isaac Newton Telescope shows high-energy X-rays emitted by young, massive stars in the star cluster Cygnus OB2. This year we're celebrating the 20th anniversary of Chandra's launch. Want to dive deeper? Click here
Make sure to follow us on Tumblr for your regular dose of space: http://nasa.tumblr.com.
Amazing Earth: Satellite Images from 2020
In the vastness of the universe, the life-bringing beauty of our home planet shines bright. During this tumultuous year, our satellites captured some pockets of peace, while documenting data and striking visuals of unprecedented natural disasters. As 2020 comes to a close, we’re diving into some of the devastation, wonders, and anomalies this year had to offer.
NASA’s fleet of Earth-observing satellites and instruments on the International Space Station unravel the complexities of the blue marble from a cosmic vantage point. These robotic scientists orbit our globe constantly, monitoring and notating changes, providing crucial information to researchers here on the ground.
Take a glance at 2020 through the lens of NASA satellites:
A Delta Oasis in Southeastern Kazakhstan

Seen from space, the icy Ili River Delta contrasts sharply with the beige expansive deserts of southeastern Kazakhstan.
When the Operational Land Imager (OLI) on Landsat 8 acquired this natural-color image on March 7, 2020, the delta was just starting to shake off the chill of winter. While many of the delta’s lakes and ponds were still frozen, the ice on Lake Balkhash was breaking up, revealing swirls of sediment and the shallow, sandy bed of the western part of the lake.
The expansive delta and estuary is an oasis for life year round. Hundreds of plant and animal species call it home, including dozens that are threatened or endangered.
Fires and Smoke Engulf Southeastern Australia

A record-setting and deadly fire season marred the beginning of the year in Australia. Residents of the southeastern part of the country told news media about daytime seeming to turn to night, as thick smoke filled the skies and intense fires drove people from their homes.
This natural-color image of Southeastern Australia was acquired on January 4, 2020, by the Moderate Resolution Imaging Spectroradiometer (MODIS) on NASA’s Aqua satellite. The smoke has a tan color, while clouds are bright white. It is likely that some of the white patches above the smoke are pyrocumulonimbus clouds—clouds created by the convection and heat rising from a fire.
Nighttime Images Capture Change in China

A team of scientists from NASA’s Goddard Space Flight Center (GSFC) and Universities Space Research Association (USRA) detected signs of the shutdown of business and transportation around Hubei province in central China. As reported by the U.S. State Department, Chinese authorities suspended air, road, and rail travel in the area and placed restrictions on other activities in late January 2020 in response to the COVID-19 outbreak in the region.
A research team analyzed images of Earth at night to decipher patterns of energy use, transportation, migration, and other economic and social activities. Data for the images were acquired with the Visible Infrared Imaging Radiometer Suite (VIIRS) on the NOAA–NASA Suomi NPP satellite (launched in 2011) and processed by GSFC and USRA scientists. VIIRS has a low-light sensor—the day/night band—that measures light emissions and reflections. This capability has made it possible to distinguish the intensity, types, and sources of lights and to observe how they change.
The Parched Paraná River

Though a seemingly serene oasis from above, there is more to this scene than meets the eye. On July 3, 2020, the Operational Land Imager (OLI) on Landsat 8 captured this false-color image of the river near Rosario, a key port city in Argentina. The combination of shortwave infrared and visible light makes it easier to distinguish between land and water. A prolonged period of unusually warm weather and drought in southern Brazil, Paraguay, and northern Argentina dropped the Paraná River to its lowest water levels in decades. The parched river basin has hampered shipping and contributed to an increase in fire activity in the delta and floodplain.
The drought has affected the region since early 2020, and low water levels have grounded several ships, and many vessels have had to reduce their cargo in order to navigate the river. With Rosario serving as the distribution hub for much of Argentina’s soy and other farm exports, low water levels have caused hundreds of millions of dollars in losses for the grain sector, according to news reports.
Historic Fires Devastate the U.S. Pacific Coast

Climate and fire scientists have long anticipated that fires in the U.S. West would grow larger, more intense, and more dangerous. But even the most experienced among them have been at a loss for words in describing the scope and intensity of the fires burning in West Coast states during September 2020.
Lightning initially triggered many of the fires, but it was unusual and extreme meteorological conditions that turned some of them into the worst conflagrations in the region in decades.
Throughout the outbreak, sensors like the Visible Infrared Imaging Radiometer Suite (VIIRS) and the Ozone Mapping and Profiler Suite (OMPS) on the NOAA-NASA Suomi NPP satellite collected daily images showing expansive, thick plumes of aerosol particles blowing throughout the U.S. West on a scale that satellites and scientists rarely see.
This image shows North America on September 9th, 2020, as a frontal boundary moved into the Great Basin and produced very high downslope winds along the mountains of Washington, Oregon, and California. The winds whipped up the fires, while a pyrocumulus cloud from the Bear fire in California injected smoke high into the atmosphere. The sum of these events was an extremely thick blanket of smoke along the West Coast.
The Sandy Great Bahama Bank

Though the bright blues of island waters are appreciated by many from a sea-level view, their true beauty is revealed when photographed from space. The underwater masterpiece photographed above is composed of sand dunes off the coast of the Bahamas.
The Great Bahama Bank was dry land during past ice ages, but it slowly submerged as sea levels rose. Today, the bank is covered by water, though it can be as shallow as two meters (seven feet) deep in places. The wave-shaped ripples in the image are sand on the seafloor. The curves follow the slopes of the dunes, which were likely shaped by a fairly strong current near the sea bottom. Sand and seagrass are present in different quantities and depths, giving the image it’s striking range of blues and greens.
This image was captured on February 15th, 2020, by Landsat 8, whose predecessor, Landsat 7, was the first land-use satellite to take images over coastal waters and the open ocean. Today, many satellites and research programs map and monitor coral reef systems, and marine scientists have a consistent way to observe where the reefs are and how they are faring.
Painting Pennsylvania Hills

Along with the plentiful harvest of crops in North America, one of the gifts of Autumn is the gorgeous palette of colors created by the chemical transition and fall of leaves from deciduous trees.
The folded mountains of central Pennsylvania were past peak leaf-peeping season but still colorful when the Operational Land Imager (OLI) on the Landsat 8 satellite passed over on November 9, 2020. The natural-color image above shows the hilly region around State College, Pennsylvania overlaid on a digital elevation model to highlight the topography of the area.
The region of rolling hills and valleys is part of a geologic formation known as the Valley and Ridge Province that stretches from New York to Alabama. These prominent folds of rock were mostly raised up during several plate tectonic collisions and mountain-building episodes in the Ordovician Period and later in the creation of Pangea—when what is now North America was connected with Africa in a supercontinent. Those events created the long chain of the Appalachians, one of the oldest mountain ranges in the world.
A Dangerous Storm in the Night

Ominous and looming, a powerful storm hovered off the US coastline illuminated against the dark night hues.
The Visible Infrared Imaging Radiometer Suite (VIIRS) on NOAA-20 acquired this image of Hurricane Laura at 2:20 a.m. Central Daylight Time on August 26, 2020. Clouds are shown in infrared using brightness temperature data, which is useful for distinguishing cooler cloud structures from the warmer surface below. That data is overlaid on composite imagery of city lights from NASA’s Black Marble dataset.
Hurricane Laura was among the ten strongest hurricanes to ever make landfall in the United States. Forecasters had warned of a potentially devastating storm surge up to 20 feet along the coast, and the channel might have funneled that water far inland. It did not. The outcome was also a testament to strong forecasting and communication by the National Hurricane Center and local emergency management authorities in preparing the public for the hazards.
A Windbreak Grid in Hokkaido

From above, the Konsen Plateau in eastern Hokkaido offers a remarkable sight: a massive grid that spreads across the rural landscape like a checkerboard, visible even under a blanket of snow. Photographed by the Operational Land Imager (OLI) on Landsat 8, this man-made design is not only aesthetically pleasing, it’s also an agricultural insulator.
The strips are forested windbreaks—180-meter (590-foot) wide rows of coniferous trees that help shelter grasslands and animals from Hokkaido’s sometimes harsh weather. In addition to blocking winds and blowing snow during frigid, foggy winters, they help prevent winds from scattering soil and manure during the warmer months in this major dairy farming region of Japan.
Shadows from a Solar Eclipse

Formidable, rare, and awe-inspiring — the first and only total solar eclipse of 2020 occurred on December 14, with the path of totality stretching from the equatorial Pacific to the South Atlantic and passing through southern Argentina and Chile as shown in the lower half of the image above. The Advanced Baseline Imager (ABI) on Geostationary Operational Environmental Satellite 16 (GOES-16) captured these images of the Moon’s shadow crossing the face of Earth.
The “path of totality” (umbral path) for the eclipse was roughly 90 kilometers (60 miles) wide and passed across South America from Saavedra, Chile, to Salina del Eje, Argentina. While a total eclipse of the Sun occurs roughly every 18 months, seeing one from any particular location on Earth is rare. On average, a solar eclipse passes over the same parcel of land roughly every 375 years. The next total solar eclipse will occur on December 4, 2021 over Antarctica, and its next appearance over North America is projected for April 8, 2024.
For additional information and a look at more images like these visit NASA’s Earth Observatory.
Make sure to follow us on Tumblr for your regular dose of space: http://nasa.tumblr.com.

🌊🌊🌊 This natural-color image captured May 17 near the coast of Guinea-Bissau in West Africa shows estuaries branching out like a network of roots from a plant. Crossfading to a data visualization helps reveals water clarity due to dissolved organic matter in Guinea-Bissau.
With their long tendrils, the rivers meander through the country’s lowland plains to join the Atlantic Ocean. On the way, they carry water, nutrients, but also sediments out from the land. These estuaries play an important role in agriculture for this small country that is mostly made up of flat terrain. While the coastal valleys can flood often during the rainiest part of the year in the summer, the rain makes the valleys good locations for farming, especially rice cultivation. Using satellite data, researchers continue to observe the country's change in terrain and as a result, they're documenting a regrowth of previously eroded coastal areas.
Learn more
Make sure to follow us on Tumblr for your regular dose of space: http://nasa.tumblr.com
-
 sentientdeskchair-blog liked this · 9 months ago
 -
 puhatiikeri liked this · 1 year ago
 -
 paliacaointermitente liked this · 1 year ago
 -
 kanvalesense reblogged this · 3 years ago
 -
 sorrentosunsets reblogged this · 3 years ago
 -
 killingthechorus liked this · 3 years ago
 -
 soleiljan liked this · 3 years ago
 -
 the-world-and-space reblogged this · 3 years ago
 -
 lunar-monster liked this · 3 years ago
 -
 winches-ter liked this · 3 years ago
 -
 fanoftoday liked this · 4 years ago
 -
 firetotheflowers liked this · 4 years ago
 -
 jeffreymassey liked this · 4 years ago
 -
 solroja liked this · 4 years ago
 -
 crinium-powellii reblogged this · 4 years ago
 -
 extratus-cirrus liked this · 4 years ago
 -
 bluedogs-stuff liked this · 4 years ago
 -
 mylovesurreal liked this · 4 years ago
 -
 iamlilac liked this · 4 years ago
 -
 toph-baebong reblogged this · 4 years ago
 -
 development-of-an-insanity liked this · 4 years ago
 -
 annoyinglyeclecticruins reblogged this · 4 years ago
 -
annoyinglyeclecticruins liked this · 4 years ago
-
 thepartwhereyourun reblogged this · 4 years ago
Explore the universe and discover our home planet with the official NASA Tumblr account
1K posts