Your personal Tumblr journey starts here
Clouds - Blog Posts
The Smoke From a (Not-so) Distant Fire
Flying directly through thick plumes of smoke may seem more harrowing than exciting. But for members of the CAMP2Ex science team, the chance to fly a P-3 Orion straight through clouds of smoke billowing off fires from Borneo this week was too good an opportunity to pass up.

CAMP2Ex stands for the Cloud, Aerosol and Monsoon Processes in the Philippines Experiment. The 2, by the way, is silent.

It’s a field campaign based out of Clark in the Philippines, flying our P-3, a Learjet and collaborating with researchers on the research vessel Sally Ride to understand how tiny particles in the atmosphere affect cloud formations and monsoon season.

The tiny aerosol particles we’re looking at don’t just come from smoke. Aerosol particles also come from pollution, billowing dust and sea salt from the ocean. They can have an outsized effect on weather and climate, seeding clouds that bring rain and altering how the atmosphere absorbs the Sun’s heat.

The smoke we were flying Monday came from peat fires, burning through the soil. That’s pretty unusual — the last time Borneo had these kind of fires was in 2015, so it was a rare opportunity to sample the chemistry of the smoke and find out what’s mixing with the air.

The planes are loaded with instruments to learn more about aerosol particles and the makeup of clouds, like this high-speed camera that captures images of the particles in flight.

One instrument on the plane collects droplets of cloud water as the plane flies through them, and on the ground, we test how acidic and what kind of particles form the cloud drops.

All of these measurements are tools in improving our understanding of the interaction between particles in the air and clouds, rainfall and precipitation in the Pacific Ocean.

Learn more about the CAMP2Ex field campaign, here!
Make sure to follow us on Tumblr for your regular dose of space: http://nasa.tumblr.com
A room with Earth views! 🌎 Earlier this week, astronaut Ricky Arnold captured this spectacular view of our home planet while he was orbiting at a speed of 17,500 miles per hour. If you’re wondering where in the world this video was taken, it starts as the International Space Station is above San Francisco and moving southward through the Americas.
Each day, the station completes 16 orbits of our home planet as the six humans living and working aboard our orbiting laboratory conduct important science and research. Their work will not only benefit life here on Earth, but will help us venture deeper into space than ever before.
Make sure to follow us on Tumblr for your regular dose of space: http://nasa.tumblr.com

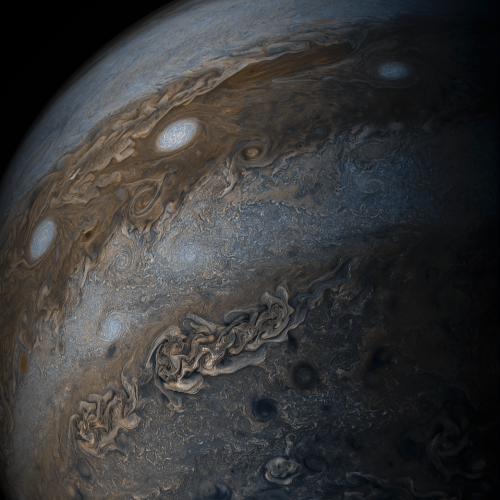
During a recent close flyby of the gas giant Jupiter, our Juno spacecraft captured this stunning series of images showing swirling cloud patterns on the planet’s south pole. At first glance, the series might appear to be the same image repeated. But closer inspection reveals slight changes, which are most easily noticed by comparing the far-left image with the far-right image.
Directly, the images show Jupiter. But, through slight variations in the images, they indirectly capture the motion of the Juno spacecraft itself, once again swinging around a giant planet hundreds of millions of miles from Earth.
Juno captured this color-enhanced time-lapse sequence of images on Feb. 7 between 10:21 a.m. and 11:01 a.m. EST. At the time, the spacecraft was between 85,292 to 124,856 miles (137,264 to 200,937 kilometers) from the tops of the clouds of the planet with the images centered on latitudes from 84.1 to 75.5 degrees south.
Credit: NASA/JPL-Caltech/SwRI/MSSS/Gerald Eichstädt
Make sure to follow us on Tumblr for your regular dose of space: http://nasa.tumblr.com.

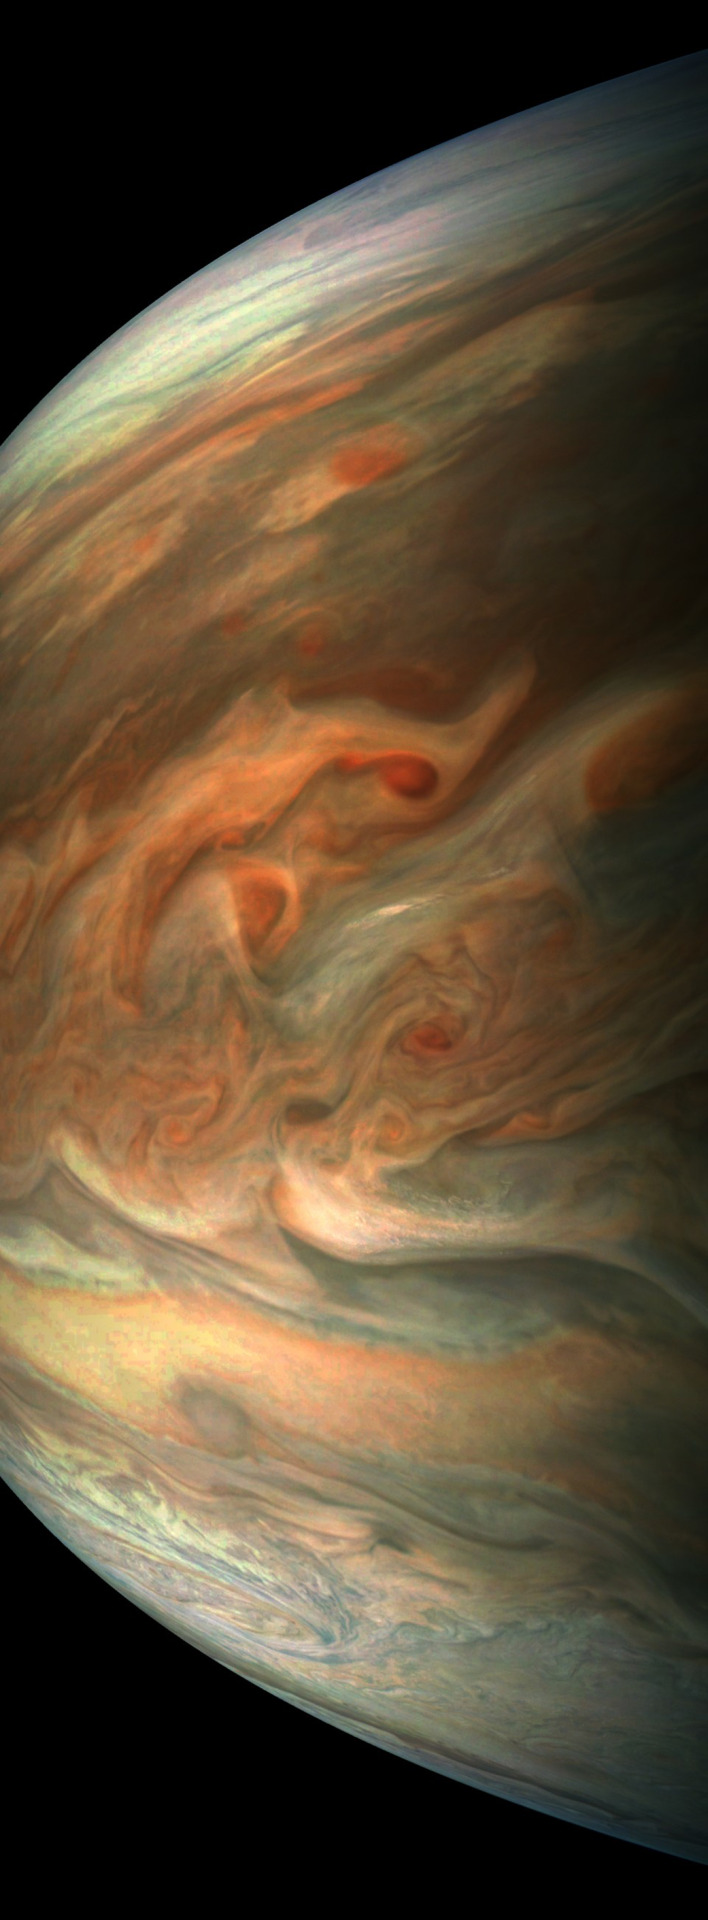
Jupiter’s vibrant bands of light belts and dark regions appear primed for their close-up during our Juno spacecraft’s 10th flyby on Feb. 7. This flyby was a gravity science positioned pass. During orbits that highlight gravity experiments, Juno is positioned toward Earth in a way that allows both transmitters to downlink data in real-time to one of the antennas of our Deep Space Network. All of Juno’s science instruments and the spacecraft’s JunoCam were in operation during the flyby, collecting data that is now being returned to Earth. The science behind this beautifully choreographed image will help us understand the origin and structure of the planet beneath those lush, swirling clouds.
Make sure to follow us on Tumblr for your regular dose of space: http://nasa.tumblr.com
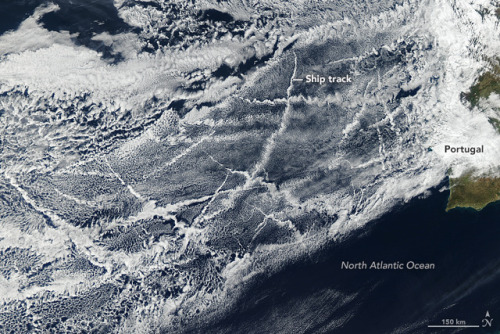
A patchwork of bright, criss-crossing cloud trails was created by ships churning through the Atlantic Ocean off the coast of Portugal and Spain in this image captured by one of our Earth observing satellites. The narrow clouds known as ship tracks, form when water vapor condenses around tiny particles of pollution that ships emit.
Some of the pollution particles generated by ships (especially sulfates) are soluble in water and serve as the seeds around which cloud droplets form. Clouds infused with ship exhaust have more and smaller droplets than unpolluted clouds. Because of this, the light hitting the polluted clouds scatters in many directions, making them appear brighter and thicker than unpolluted marine clouds, which are typically seeded by larger, naturally occurring particles such as sea salt.
Learn more about this image HERE.
Make sure to follow us on Tumblr for your regular dose of space: http://nasa.tumblr.com.
Solar System: 10 Things to Know This Week
January 8: Images for Your Computer or Phone Wallpaper
Need some fresh perspective? Here are 10 vision-stretching images for your computer desktop or phone wallpaper. These are all real pictures, sent recently by our planetary missions throughout the solar system. You'll find more of our images at solarsystem.nasa.gov/galleries, images.nasa.gov and www.jpl.nasa.gov/spaceimages.
Applying Wallpaper: 1. Click on the screen resolution you would like to use. 2. Right-click on the image (control-click on a Mac) and select the option 'Set the Background' or 'Set as Wallpaper' (or similar).
1. The Fault in Our Mars

This image from our Mars Reconnaissance Orbiter (MRO) of northern Meridiani Planum shows faults that have disrupted layered deposits. Some of the faults produced a clean break along the layers, displacing and offsetting individual beds.
Desktop: 1280 x 800 | 1600 x 1200 | 1920 x 1200 Mobile: 1440 x 2560 | 1080 x 1920 | 750 x 1334
2. Jupiter Blues

Our Juno spacecraft captured this image when the spacecraft was only 11,747 miles (18,906 kilometers) from the tops of Jupiter's clouds -- that's roughly as far as the distance between New York City and Perth, Australia. The color-enhanced image, which captures a cloud system in Jupiter's northern hemisphere, was taken on Oct. 24, 2017, when Juno was at a latitude of 57.57 degrees (nearly three-fifths of the way from Jupiter's equator to its north pole) and performing its ninth close flyby of the gas giant planet.
Desktop: 1280 x 800 | 1600 x 1200 | 1920 x 1200 Mobile: 1440 x 2560 | 1080 x 1920 | 750 x 1334
3. A Farewell to Saturn

After more than 13 years at Saturn, and with its fate sealed, our Cassini spacecraft bid farewell to the Saturnian system by firing the shutters of its wide-angle camera and capturing this last, full mosaic of Saturn and its rings two days before the spacecraft's dramatic plunge into the planet's atmosphere on Sept. 15, 2017.
Desktop: 1280 x 800 | 1600 x 1200 | 1920 x 1200 Mobile: 1440 x 2560 | 1080 x 1920 | 750 x 1334
4. All Aglow

Saturn's moon Enceladus drifts before the rings, which glow brightly in the sunlight. Beneath its icy exterior shell, Enceladus hides a global ocean of liquid water. Just visible at the moon's south pole (at bottom here) is the plume of water ice particles and other material that constantly spews from that ocean via fractures in the ice. The bright speck to the right of Enceladus is a distant star. This image was taken in visible light with the Cassini spacecraft narrow-angle camera on Nov. 6, 2011.
Desktop: 1280 x 800 | 1600 x 1200 | 1920 x 1200 Mobile: 1440 x 2560 | 1080 x 1920 | 750 x 1334
5. Rare Encircling Filament

Our Solar Dynamics Observatory came across an oddity this week that the spacecraft has rarely observed before: a dark filament encircling an active region (Oct. 29-31, 2017). Solar filaments are clouds of charged particles that float above the Sun, tethered to it by magnetic forces. They are usually elongated and uneven strands. Only a handful of times before have we seen one shaped like a circle. (The black area to the left of the brighter active region is a coronal hole, a magnetically open region of the Sun).
Desktop: 1280 x 800 | 1600 x 1200 | 1920 x 1200 Mobile: 1440 x 2560 | 1080 x 1920 | 750 x 1334
6. Jupiter's Stunning Southern Hemisphere

See Jupiter's southern hemisphere in beautiful detail in this image taken by our Juno spacecraft. The color-enhanced view captures one of the white ovals in the "String of Pearls," one of eight massive rotating storms at 40 degrees south latitude on the gas giant planet. The image was taken on Oct. 24, 2017, as Juno performed its ninth close flyby of Jupiter. At the time the image was taken, the spacecraft was 20,577 miles (33,115 kilometers) from the tops of the clouds of the planet.
Desktop: 1280 x 800 | 1600 x 1200 | 1920 x 1200 Mobile: 1440 x 2560 | 1080 x 1920 | 750 x 1334
7. Saturn's Rings: View from Beneath

Our Cassini spacecraft obtained this panoramic view of Saturn's rings on Sept. 9, 2017, just minutes after it passed through the ring plane. The view looks upward at the southern face of the rings from a vantage point above Saturn's southern hemisphere.
Desktop: 1280 x 800 | 1600 x 1200 | 1920 x 1200 Mobile: 1440 x 2560 | 1080 x 1920 | 750 x 1334
8. From Hot to Hottest

This sequence of images from our Solar Dynamics Observatory shows the Sun from its surface to its upper atmosphere all taken at about the same time (Oct. 27, 2017). The first shows the surface of the sun in filtered white light; the other seven images were taken in different wavelengths of extreme ultraviolet light. Note that each wavelength reveals somewhat different features. They are shown in order of temperature, from the first one at about 11,000 degrees Fahrenheit (6,000 degrees Celsius) on the surface, out to about 10 million degrees in the upper atmosphere. Yes, the sun's outer atmosphere is much, much hotter than the surface. Scientists are getting closer to solving the processes that generate this phenomenon.
Desktop: 1280 x 800 | 1600 x 1200 | 1920 x 1200 Mobile: 1440 x 2560 | 1080 x 1920 | 750 x 1334
9. High Resolution View of Ceres

This orthographic projection shows dwarf planet Ceres as seen by our Dawn spacecraft. The projection is centered on Occator Crater, home to the brightest area on Ceres. Occator is centered at 20 degrees north latitude, 239 degrees east longitude.
Desktop: 1280 x 800 | 1600 x 1200 | 1920 x 1200 Mobile: 1440 x 2560 | 1080 x 1920 | 750 x 1334
10. In the Chasm

This image from our Mars Reconnaissance Orbiter shows a small portion of the floor of Coprates Chasma, a large trough within the Valles Marineris system of canyons. Although the exact sequence of events that formed Coprates Chasma is unknown, the ripples, mesas, and craters visible throughout the terrain point to a complex history involving multiple mechanisms of erosion and deposition. The main trough of Coprates Chasma ranges from 37 miles (60 kilometers) to 62 miles (100 kilometers) in width.
Desktop: 1280 x 800 | 1600 x 1200 | 1920 x 1200 Mobile: 1440 x 2560 | 1080 x 1920 | 750 x 1334
Explore and learn more about our solar system at: solarsystem.nasa.gov/.
Make sure to follow us on Tumblr for your regular dose of space: http://nasa.tumblr.com.
What Scientists Are Learning from the Eclipse
While millions of people in North America headed outside to watch the eclipse on Aug. 21, 2017, hundreds of scientists got out telescopes, set up instruments, and prepared balloon launches – all so they could study the Sun and its complicated influence on Earth.

Total solar eclipses happen about once every 18 months somewhere in the world, but the August eclipse was rare because of its long path over land. The total eclipse lasted more than 90 minutes over land, from when it first reached Oregon to when it left the U.S. in South Carolina.

This meant that scientists could collect more data from land than during most eclipses, giving us new insight into our world and the star that powers it.
A moment in the Sun’s atmosphere
During a total solar eclipse, the Sun’s outer atmosphere, the corona, is visible from Earth. It’s normally too dim to see next to the Sun’s bright face, but, during an eclipse, the Moon blocks out the Sun, revealing the corona.

Image Credit: Peter Aniol, Miloslav Druckmüller and Shadia Habbal
Though we can study parts of the corona with instruments that create artificial eclipses, some of the innermost regions of the corona are only visible during total solar eclipses. Solar scientists think this part of the corona may hold the secrets to some of our most fundamental questions about the Sun: Like how the solar wind – the constant flow of magnetized material that streams out from the Sun and fills the solar system – is accelerated, and why the corona is so much hotter than the Sun’s surface below.
Depending on where you were, someone watching the total solar eclipse on Aug. 21 might have been able to see the Moon completely obscuring the Sun for up to two minutes and 42 seconds. One scientist wanted to stretch that even further – so he used a pair of our WB-57 jets to chase the path of the Moon’s shadow, giving their telescopes an uninterrupted view of the solar corona for just over seven and half minutes.

These telescopes were originally designed to help monitor space shuttle launches, and the eclipse campaign was their first airborne astronomy project!

These scientists weren’t the only ones who had the idea to stretch out their view of the eclipse: The Citizen CATE project (short for Continental-America Telescopic Eclipse) did something similar, but with the help of hundreds of citizen scientists.
Citizen CATE included 68 identical small telescopes spread out across the path of totality, operated by citizen and student scientists. As the Moon’s shadow left one telescope, it reached the next one in the lineup, giving scientists a longer look at the way the corona changes throughout the eclipse.

After accounting for clouds, Citizen CATE telescopes were able to collect 82 minutes of images, out of the 93 total minutes that the eclipse was over the US. Their images will help scientists study the dynamics of the inner corona, including fast solar wind flows near the Sun’s north and south poles.
The magnetized solar wind can interact with Earth’s magnetic field, causing auroras, interfering with satellites, and – in extreme cases – even straining our power systems, and all these measurements will help us better understand how the Sun sends this material speeding out into space.
Exploring the Sun-Earth connection
Scientists also used the eclipse as a natural laboratory to explore the Sun’s complicated influence on Earth.
High in Earth’s upper atmosphere, above the ozone layer, the Sun’s intense radiation creates a layer of electrified particles called the ionosphere. This region of the atmosphere reacts to changes from both Earth below and space above. Such changes in the lower atmosphere or space weather can manifest as disruptions in the ionosphere that can interfere with communication and navigation signals.

One group of scientists used the eclipse to test computer models of the ionosphere’s effects on these communications signals. They predicted that radio signals would travel farther during the eclipse because of a drop in the number of energized particles. Their eclipse day data – collected by scientists spread out across the US and by thousands of amateur radio operators – proved that prediction right.
In another experiment, scientists used the Eclipse Ballooning Project to investigate the eclipse’s effects lower in the atmosphere. The project incorporated weather balloon flights from a dozen locations to form a picture of how Earth’s lower atmosphere – the part we interact with and which directly affects our weather – reacted to the eclipse. They found that the planetary boundary layer, the lowest part of Earth’s atmosphere, actually moved closer to Earth during the eclipse, dropped down nearly to its nighttime altitude.

A handful of these balloons also flew cards containing harmless bacteria to explore the potential for contamination of other planets with Earth-born life. Earth’s stratosphere is similar to the surface of Mars, except in one main way: the amount of sunlight. But during the eclipse, the level of sunlight dropped to something closer to what you’d expect to see on Mars, making this the perfect testbed to explore whether Earth microbes could hitch a ride to the Red Planet and survive. Scientists are working through the data collected, hoping to build up better information to help robotic and human explorers alike avoid carrying bacterial hitchhikers to Mars.

Image: The small metal card used to transport bacteria.
Finally, our EPIC instrument aboard NOAA’s DSCOVR satellite provided awe-inspiring views of the eclipse, but it’s also helping scientists understand Earth’s energy balance. Earth’s energy system is in a constant dance to maintain a balance between incoming radiation from the Sun and outgoing radiation from Earth to space, which scientists call the Earth’s energy budget. The role of clouds, both thick and thin, is important in their effect on energy balance.

Like a giant cloud, the Moon during the total solar eclipse cast a large shadow across a swath of the United States. Scientists know the dimensions and light-blocking properties of the Moon, so they used ground- and space-based instruments to learn how this large shadow affects the amount of sunlight reaching Earth’s surface, especially around the edges of the shadow. Measurements from EPIC show a 10% drop in light reflected from Earth during the eclipse (compared to about 1% on a normal day). That number will help scientists model how clouds radiate the Sun’s energy – which drives our planet’s ocean currents, seasons, weather and climate – away from our planet.
For even more eclipse science updates, stay tuned to nasa.gov/eclipse.
Make sure to follow us on Tumblr for your regular dose of space: http://nasa.tumblr.com.
Solar System: Things to Know This Week
Our Juno mission has been exploring Jupiter since July 2016 with a special passenger on board: JunoCam, an instrument designed to take spectacular close-up color images of the largest planet in our solar system. From the raw images, citizen scientists have processed a range of beautiful photographs that highlight Jupiter's features, even turning them into works of art. Below, 10 stunning images JunoCam has given us over the past year.
1. Jovian tempest.

This color-enhanced image of a massive, raging storm in Jupiter's northern hemisphere was captured by our Juno spacecraft during its ninth close flyby on Oct. 24, 2017. The storm is rotating counter-clockwise with a wide range of cloud altitudes, and the darker clouds are expected to be deeper in the atmosphere than the brightest clouds.
2. A southern stunner.

Jupiter's southern hemisphere shows off in beautiful detail in this image taken on Oct. 24, 2017. The color-enhanced view captures one of the white ovals in the "String of Pearls," one of eight massive rotating storms at 40 degrees south latitude on the gas giant planet.
3. Dreaming in color.

Artist Mik Petter created this unique digital piece using data from the JunoCam. The art form, known as fractals, uses mathematical formulas to create an infinite variety of form, detail, color and light. The original JunoCam image was taken on July 10, 2017.
4. Jovian moon shadow.

Jupiter's moon Amalthea casts a shadow on the gas giant planet in this image taken on Sept. 1, 2017. The elongated shape of the shadow is a result of both the location of the moon with relation to Jupiter in this image as well as the irregular shape of the moon itself.
5. 95 minutes over Jupiter.

Once every 53 days, Juno swings close to Jupiter, speeding over its clouds. In about two hours, the spacecraft travels from a perch over Jupiter's north pole through its closest approach (perijove), then passes over the south pole on its way back out. This sequence shows 11 color-enhanced images from Perijove 8 (Sept. 1, 2017) with the south pole on the left (11th image in the sequence) and the north pole on the right (first image in the sequence).
6. Soaring high.
This striking image of Jupiter was taken on Sept. 1, 2017 as Juno performed its eighth flyby. The spacecraft was 4,707 miles (7,576 kilometers) from the tops of the clouds of the planet at a latitude of about -17.4 degrees. Noteworthy: "Whale's Tail" and "Dan's Spot."
7. In true color.
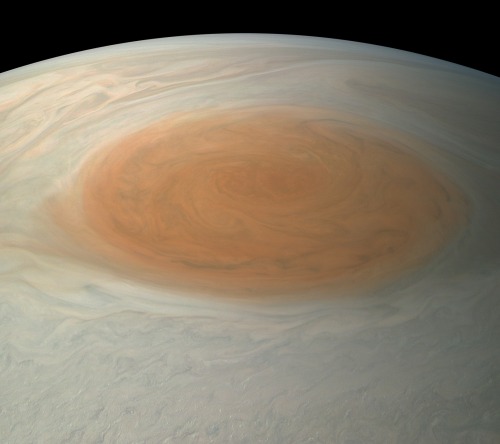
This true-color image offers a natural color rendition of what the Great Red Spot and surrounding areas would look like to human eyes from Juno's position. The image was taken on July 10, 2017 as the Juno spacecraft performed its seventh close flyby of Jupiter.
8. The 'face' of Jupiter.

JunoCam images aren't just for art and science—sometimes they're created for a good chuckle. This image, processed by citizen scientist Jason Major, is titled "Jovey McJupiterface." By rotating the image 180 degrees and orienting it from south up, two white oval storms turn into eyeballs, and the "face" of Jupiter is revealed. The original image was taken by the Juno spacecraft on May 19, 2017.
9. Bands of clouds.

This enhanced-color image of Jupiter's bands of light and dark clouds was created by citizen scientists Gerald Eichstädt and Seán Doran. Three of the white oval storms known as the "String of Pearls" are visible near the top of the image. Each of the alternating light and dark atmospheric bands in this image is wider than Earth, and each rages around Jupiter at hundreds of miles (kilometers) per hour. The lighter areas are regions where gas is rising, and the darker bands are regions where gas is sinking. Juno captured the image on May 19, 2017.
10. The edge.

This enhanced-color image of a mysterious dark spot on Jupiter seems to reveal a Jovian "galaxy" of swirling storms. Juno captured this image on Feb. 2, 2017 and citizen scientist Roman Tkachenko enhanced the color to bring out the rich detail in the storm and surrounding clouds. Just south of the dark storm is a bright, oval-shaped storm with high, bright, white clouds, reminiscent of a swirling galaxy. As a final touch, he rotated the image 90 degrees, turning the picture into a work of art.
To learn more about the Juno mission at Jupiter, visit: www.nasa.gov/juno.
Follow the Juno mission on Facebook, Instagram and Twitter.
Make sure to follow us on Tumblr for your regular dose of space: http://nasa.tumblr.com.
The 2017 Atlantic Hurricane Season: What We Learned

The 2017 Atlantic hurricane season was among the top ten most active seasons in recorded history. Our experts are exploring what made this year particularly active and the science behind some of the biggest storms to date.

After a period of 12 years without a Category 3 or higher hurricane making landfall in the U.S., Hurricane Harvey made landfall over Texas as a Category 4 hurricane this August.
Harvey was also the biggest rainfall event ever to hit the continental U.S. with estimates more than 49 inches of rain.

Data like this from our Global Precipitation Measurement Mission, which shows the amount of rainfall from the storm and temperatures within the story, are helping scientists better understand how storms develop.

The unique vantage point of satellites can also help first responders, and this year satellite data helped organizations map out response strategies during hurricanes Harvey, Irma and Maria.

In addition to satellites, we use ground stations and aircraft to track hurricanes.

We also use the capabilities of satellites like Suomi NPP and others that are able to take nighttime views. In this instance, we were able to view the power outages in Puerto Rico. This allowed first responders to see where the location of impacted urban areas.

The combined effort between us, NOAA, FEMA and other federal agencies helps us understand more about how major storms develop, how they gain strength and how they affect us.

To learn more about how we study storms, go to www.nasa.gov/Hurricanes.
Make sure to follow us on Tumblr for your regular dose of space: http://nasa.tumblr.com.
How Do Hurricanes Form?
Hurricanes are the most violent storms on Earth. People call these storms by other names, such as typhoons or cyclones, depending on where they occur.

The scientific term for ALL of these storms is tropical cyclone. Only tropical cyclones that form over the Atlantic Ocean or eastern and central Pacific Ocean are called “hurricanes.”

Whatever they are called, tropical cyclones all form the same way.
Tropical cyclones are like giant engines that use warm, moist air as fuel. That is why they form only over warm ocean waters near the equator. This warm, moist air rises and condenses to form clouds and storms.

As this warmer, moister air rises, there's less air left near the Earth's surface. Essentially, as this warm air rises, this causes an area of lower air pressure below.

This starts the 'engine' of the storm. To fill in the low pressure area, air from surrounding areas with higher air pressure pushes in. That “new” air near the Earth's surface also gets heated by the warm ocean water so it also gets warmer and moister and then it rises.

As the warm air continues to rise, the surrounding air swirls in to take its place. The whole system of clouds and wind spins and grows, fed by the ocean’s heat and water evaporating from the surface.
As the storm system rotates faster and faster, an eye forms in the center. It is vey calm and clear in the eye, with very low air pressure.

Tropical cyclones usually weaken when they hit land, because they are no longer being “fed” by the energy from the warm ocean waters. However, when they move inland, they can drop many inches of rain causing flooding as well as wind damage before they die out completely.
There are five types, or categories, of hurricanes. The scale of categories is called the Saffir-Simpson Hurricane Scale and they are based on wind speed.

How Does NASA Study Hurricanes?
Our satellites gather information from space that are made into pictures. Some satellite instruments measure cloud and ocean temperatures. Others measure the height of clouds and how fast rain is falling. Still others measure the speed and direction of winds.

We also fly airplanes into and above hurricanes. The instruments aboard planes gather details about the storm. Some parts are too dangerous for people to fly into. To study these parts, we use airplanes that operate without people.
Learn more about this and other questions by exploring NASA Space Place and the NASA/NOAA SciJinks that offer explanations of science topics for school kids.
Make sure to follow us on Tumblr for your regular dose of space: http://nasa.tumblr.com.
Credits: NASA Space Place & NASA/NOAA SciJinks
Our pale blue dot, planet Earth, is seen in this video captured by NASA astronaut Jack Fischer from his unique vantage point on the International Space Station. From 250 miles above our home planet, this time-lapse imagery takes us over the Pacific Ocean’s moon glint and above the night lights of San Francisco, CA. The thin hue of our atmosphere is visible surrounding our planet with a majestic white layer of clouds sporadically seen underneath.
The International Space Station is currently home to 6 people who are living and working in microgravity. As it orbits our planet at 17,500 miles per hour, the crew onboard is conducting important research that benefits life here on Earth.
Make sure to follow us on Tumblr for your regular dose of space: http://nasa.tumblr.com
Swirling bands of light and dark clouds on Jupiter are seen in this image made by citizen scientists using data from our Juno spacecraft. Each of the alternating light and dark atmospheric bands in this image is wider than Earth, and each rages around Jupiter at hundreds of miles (km) per hour. The lighter areas are regions where gas is rising, and the darker bands are regions where gas is sinking. This image was acquired on May 19, 2017 from about 20,800 miles (33,400km) above Jupiter's cloud tops. Learn more
Credits: NASA/JPL-Caltech/SwRI/MSSS/Gerald Eichstädt /Seán Doran
Make sure to follow us on Tumblr for your regular dose of space: http://nasa.tumblr.com